Facebook
 X
X
 Pinterest
 Copy Link
How’s the Market? Q3 2024 Review of Seattle Area Real Estate

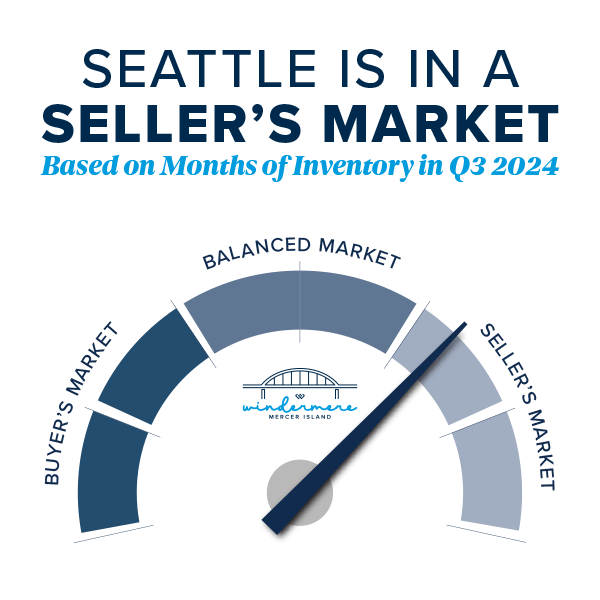
While Q3’s summertime market slowed a bit from the frenetic spring pace of Q2 (we call this the “Summer Slump”), median home values are up across the region compared to this time last year. Most homes still sold at or above their listed prices in the first 10 days on market. However, buyers had more choice with higher inventory levels AND some room to negotiate on price for those homes that stayed on the market past the 10-day mark.
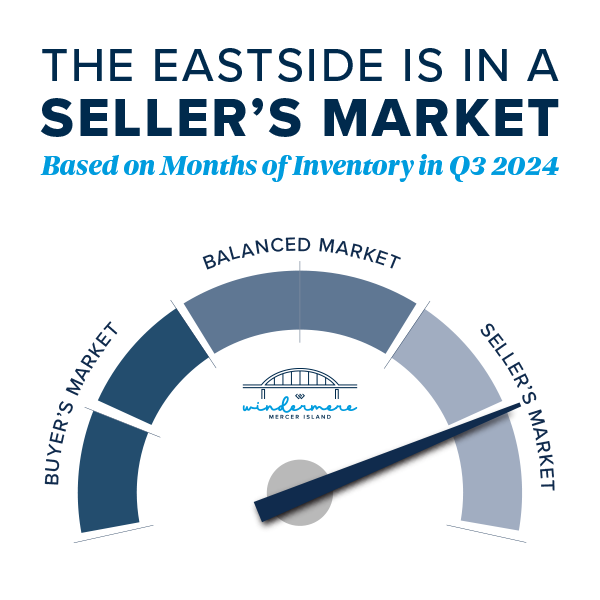
What does this mean for the rest of 2024? We typically see buyer activity decrease as we head into the holidays, and of course, it’s also election season. If you’ve been considering a purchase and are of the mindset that you don’t want to compete, THIS IS YOUR MARKET! For sellers the average days on market in Q3 was 20 for Seattle and 18 for the Eastside. Which means: if your price didn’t attract a buyer in the first two weeks, it’s probably time to re-evaluate. Interest rates are better than they’ve been since mid 2022. Quality inventory is being presented to the market. If you see a great house, be prepared to move quickly. Opportunity Knocks.
Click or scroll down to find your area report:
Seattle | Eastside | Mercer Island | Condos | Waterfront
SEATTLE
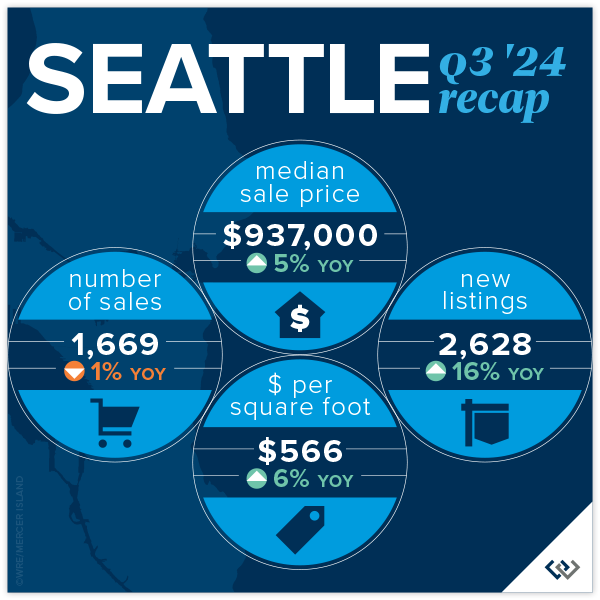
Lots of good news in Seattle during our post-summer glow. Prices are up year over year by 5% to $937,000. While we’re still under the peak median of $1,000,000 set in Q2 of 2022 and $970,000 from last quarter, this is so typical for Q3. We’ve seen it every year from Q2 to Q3 going back to 2018 (except in 2020 largely because the real estate market shut down completely in Q2). Buyers had lots of choice, with more inventory to end the quarter than we’ve had since Q3 of 2022. Even with these buyer bright spots we still saw 56% of homes sell in the first 10 days and 34% over the asking price.
Average price per square foot and median price were in positive territory across the board this quarter in all neighborhoods. Richmond Beach/Shoreline and Madison Park/Capitol Hill both saw larger than typical gains in $/sq.ft. (11%) and median price (10%) respectively. North Seattle appeared to be the “hottest” market around with 64% of homes selling in the first 10 days. Again, really great numbers in Seattle given that Summer Slump was in full effect.
 Click here for the full report and neighborhood-by-neighborhood statistics!

EASTSIDE
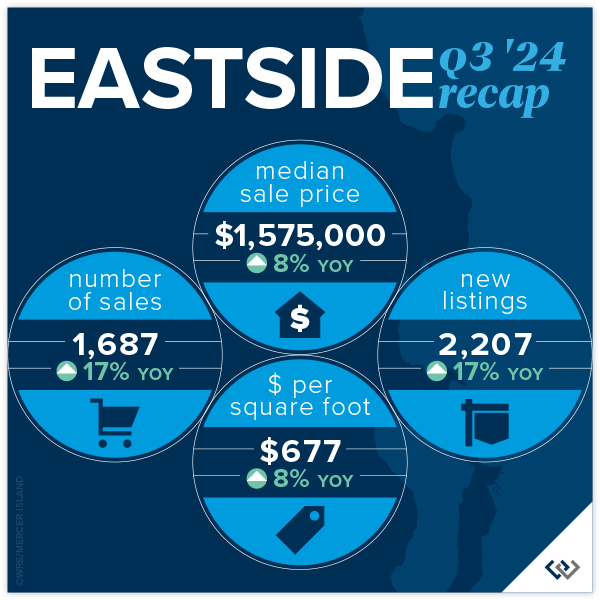
The Eastside continues to be the region’s crown jewel of real estate. Median prices are up again year over year by 8%. Most of us felt what we lovingly call the Summer Slump, and the numbers confirmed this. Prices (median) AND transactions were down 6% overall when compared against Q2 of 2024. That’s a $100,000 dip in median sales price if you missed the spring market. This is absolutely typical for the PNW and Metro King County. Seasonally our peak seasons are spring and post Labor Day/pre-holiday. This year that may be disrupted by election distractions. Time will tell if it’s a market lacking in consumer confidence or simply existential distraction.
The micro markets across the Eastside are fairly homogeneous. Among the 8 neighborhoods that we track, the median price swing was 3-11% but all in a positive direction. Total transaction volume is up 18% signaling that eventually life changes will trump a 2.5% interest rate. While homes were mostly selling in the first 10 days, multiple offers/paying over asking price were not the norm. In fact, the split between at, above, and below was relatively even.
 Click here for the full report and neighborhood-by-neighborhood statistics!

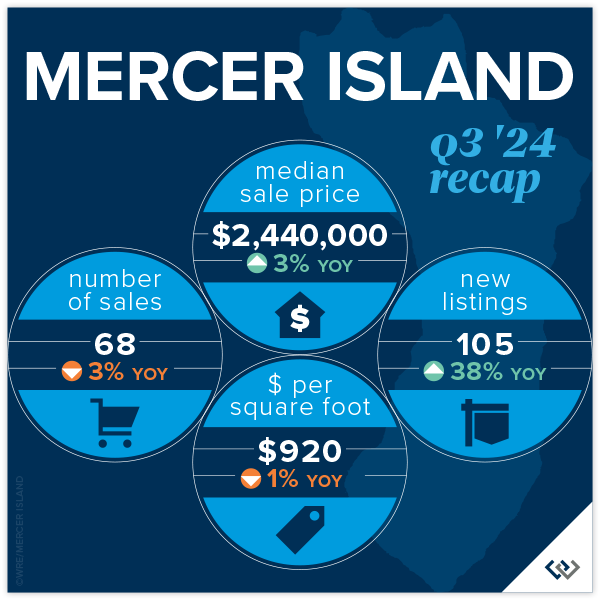
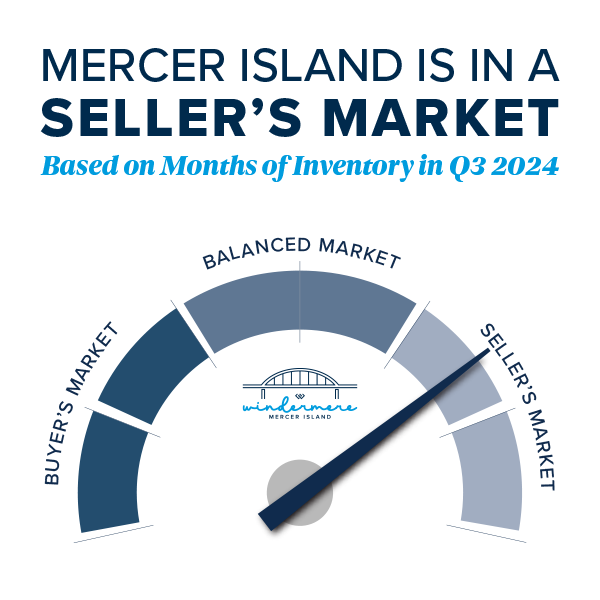
MERCER ISLAND
Fall has come for Mercer Island. The summer construction on Island Crest is done, school buses are out en force, and those filtered views that only come out in winter are starting to show. It’s time to look back fondly at the summer real estate market: prices are up YOY by 3% to $2,440,000 to end the quarter. This is likely more about trailing gains from a robust spring than it is about actual gains from Q3, given the indicators. A whopping 40% of homes sold under list price. It took 40% longer than 10 days to sell (not necessarily the same 40%) but only for about a 2% discount. This suggests that seller pricing and buyer motivation are evenly matched. There were 50 active listings at end of quarter, the most since Q2 of 2020 when real estate shut down completely.
Focusing on neighborhoods, The Lakes, Mercerwood, Mercerdale, and Mercer Island Estates saw 100% of homes sell in the first 10 days for an average of 102% of sales price. This goes to show that in any market, despite overall conditions, there will always be “hot homes.” Mid-Island had the most overall activity with 22 of the 68 sales across the Island. These occurred at $865/foot and 16 of the 22 homes sold in the first 10 days for at or above list price.
 Click here for the full report and neighborhood-by-neighborhood statistics!

CONDOS – SEATTLE & EASTSIDE
Once again, we’re rooting for the Seattle condo market as it proves to be the little engine that could! Chugging along toward modest price gains even when the rest of the market seems to be struggling a bit, Seattle condo prices have held steady for the last 6 quarters, with mostly positive change. Eastside condos hit a median price all-time high in Q2 at $709,000. We’re off of that a touch to $690,000 in Q3, to be expected after a beautiful summer. The Eastside ended the quarter with 29% more listings than this time last year and only 13% more sales. Mounting inventory tends to lead to price softening. Overall, nearly 50% of condos sold for at or above their list price!
When you compare the charts in the report, there is admittedly more positive news on the Eastside than in Seattle. Overall, we’re encouraged that despite many neighborhoods experiencing a drop in sales, average price per sq. ft. held flat and median price is up overall. On the Eastside it’s still great news all around for the market, especially in West Bellevue with 26% median sales price gains and total sales up 55%.
Friendly PSA: PLEASE remember that there is a ‘first rung’ of the property ladder. CONDOS create an affordable option to start building wealth at a younger age. It’s an important real estate product that has been overlooked. I am hopeful that enterprising young homeowners return to the condo market in droves this next real estate cycle.
Check out area-by-area details the full condo report.

WATERFRONT
While a bit slower compared to last quarter, waterfront sales remained strong in Q3 with 10 on the Eastside and 8 in Seattle. Lake Sammamish moderated in summer with just 5 sales compared to the crazy 15 we saw in spring, while Mercer Island stayed fairly steady with 4 (compared to 6 in spring). The highest sale was nearly $18 million for an immense Wendell Lovett designed 6,920 sq. ft. home on 125 feet of prime “gold coast” waterfront in Medina. The most modest sale was also on the Eastside—an original 1943 cottage on 53 feet of west-facing waterfront in Kennydale.
This brief overview of the entire Seattle-Eastside private waterfront market, including Mercer Island and Lake Sammamish, illustrates the trends occurring in our region over time. This data is interesting and insightful but cannot replace an in-depth waterfront analysis with your trusted professional.


We earn the trust and loyalty of our brokers and clients by doing real estate exceptionally well. The leader in our market, we deliver client-focused service in an authentic, collaborative, and transparent manner and with the unmatched knowledge and expertise that comes from decades of experience.
© Copyright 2024, Windermere Real Estate/Mercer Island. Information and statistics derived from Northwest Multiple Listing Service and Trendgraphix, and deemed accurate but not guaranteed. Seattle cover photo courtesy of Kathryn Buchanan and Brandon Larson, Clarity Northwest Photography. Mercer Island cover photo courtesy of The Sirianni Group and Clarity Northwest Photography. Condo cover photo courtesy of Julie Wilson and Bobby Erdt, Clarity Northwest Photography. Waterfront cover photo courtesy of Anni Zilz and Andrew Webb, Clarity Northwest Photography.
How’s the Market? Q3 2022 Real Estate Review

While still considered a seller’s market, our July-September home sale activity signaled the return of some much-needed balance. Seattle and Eastside home prices still posted year-over-year gains in Q3, but rising interest rates markedly slowed the pace of both listings and sales. Houses also stayed on the market longer than we saw during the frenzy earlier this year—the average Seattle home took 17 days to sell, while Eastside homes averaged 25 days to sell. Buyers have a great opportunity to negotiate better terms now with an eye out to refinance when interest rates come down in the future.
Click or scroll down to find your area report:
Seattle | Eastside | Mercer Island | Condos | Waterfront
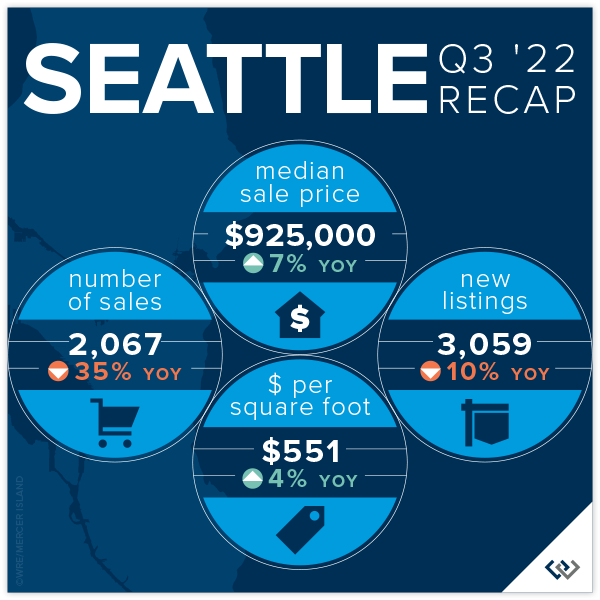
SEATTLE
There is a lot of good news in Seattle these days: Progress is being made in taking back downtown, the West Seattle Bridge is open AND real estate prices are UP year over year.
Transaction volume is down 35% across the city, which we can likely attribute to the volatility in interest rates, but listing volume is also down 10%. This is comforting! Supply and demand rules the market, and the last thing this balancing market needs is more inventory. We think this drop in seller enthusiasm is likely caused by the golden handcuffs of their historically low interest rates and refinance boom: even if your home isn’t meeting your needs these days, that 2.75% interest rate might be hard to give up.
Seattle’s average list/sold price ratio is 97%. This means if you listed your home for $1,000,000 you could expect to sell for $970,000 in Q3 of this year. Compare this with 82% on the Eastside. Seattle home sellers are more realistic and less affected by the price bloat of the last several years. We didn’t boom as hard, and we may not feel the impacts of a market balance as sharply either.
Click here for the full report and neighborhood-by-neighborhood statistics!

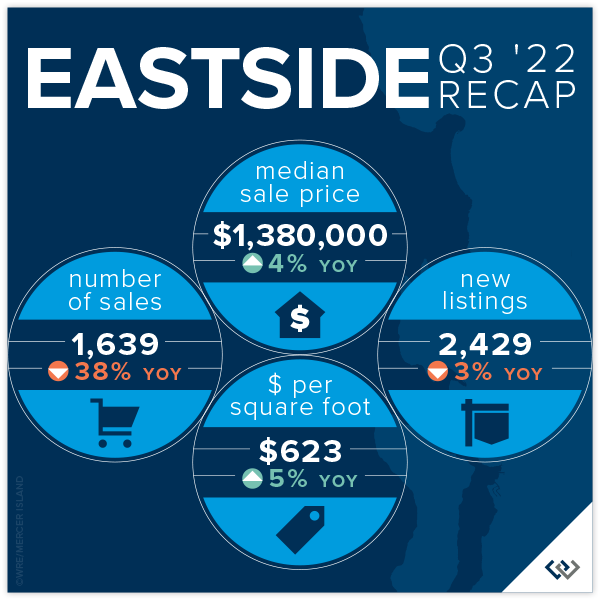
EASTSIDE
While we’re finally seeing the numbers reflect what the market has been feeling since May, it’s not as dire as one might think. Sales volume has slowed 38% year over year (based on total transaction count). However, new listings are also down (3%) which means the market reaching its peak has not sparked a sell off. This should keep our new normal buzzing along at pace similar to 2018 and 2019. Great homes that are priced right will sell—21% of homes sold above asking price and 40% of homes sold in the first 10 days.
Median list price is down 6% while median sales price is down 14.5%, which means homeowners looking to sell on the Eastside now have some data points to help them with realistic expectations of how to find the market. Average days on market is 25, which is higher than it’s been since Q1 of 2020! This is still slightly under the 6-year average. Don’t be tempted to think that there is something wrong with a home just because it has been on the market for a month; there are a lot of quality homes ready for their new owners.
The news of the day is interest rates. Heavy volatility in the markets and the administration’s drive to stem inflation have caused many buyers to pull out of the market. If you’re thinking you’ll wait for lower rates AND lower prices, you might be dreaming—if rates come down next year as predicted it will likely spur activity on. Our best advice: THIS is the market you’ve been waiting for. As a buyer you have choice, time and negotiating power for the first time since 2018. Capitalize! Then, refinance later.
Click here for the full report and neighborhood-by-neighborhood statistics!

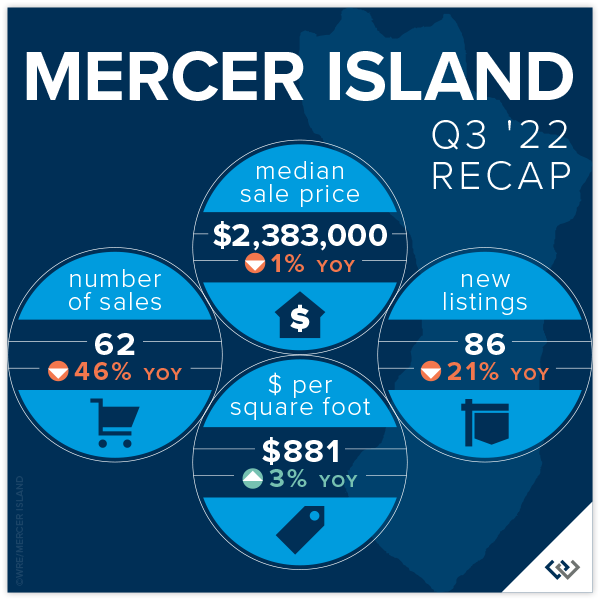
MERCER ISLAND
Given the broader local news, we might expect doom and gloom from Q3 stats—this expert sees lots of opportunity and much needed stabilization after the crazy COVID boom. While median prices have fallen 1% year over year, the average price per square foot is actually UP. What does this mean? Comparing a median with an average is always a little tricky, but this likely points to a slowdown in the sale of larger homes.
To me, the better signs of market predictability are the months supply of inventory for the quarter (about 6 weeks for both condos and single family) and the average days on market (18 for sf and 57 for condo). These are all relatively healthy benchmarks, even though they’re markedly higher than in previous quarters. This is what’s causing media to report doom and gloom: inventory is up sharply (there was ONE active listing at the end of Q4 2021 vs 44 at the end of Q3 2022) and pending sales are down (57 vs. 94 last year in the same time period). When you compare our current numbers to any time period outside of the last two years, we’re faring very well!
The news of the day is interest rates. Heavy volatility in the markets and the administration’s drive to stem inflation have caused many buyers to pull out of the market. If you’re thinking you’ll wait for lower rates AND lower prices, you might be dreaming—if rates come down next year as predicted it will likely spur activity on. Our best advice: THIS is the market you’ve been waiting for. As a buyer you have choice, time and negotiating power for the first time since 2018. Capitalize! Then, refinance later.
Click here for the full report and neighborhood-by-neighborhood statistics!

CONDOS – SEATTLE & EASTSIDE
Condos remain the tortoise as opposed to the hare like residential markets of 2020-early 2022. Slow and steady will definitely win this race as the affordability of homeownership shrinks with rising interest rates. Looking at combined condo data (Eastside + Seattle), months supply of inventory is down to about 6 weeks from 2 months last quarter. Low months supply of inventory and low cumulative days on market (23) are two of the leading indicators of market health, and both are as low or lower as they’ve been in the recent past.
Condo prices are also holding strong with no change to the average $ per square foot in Seattle and an overall 5% rise in median sale price year over year. The Eastside tells an even slightly better story: a 9% rise in $ per square foot and a 6% rise in median sale price despite a 41% year-over-year drop in the number of transactions.
Keep rooting for the tortoise. This is a necessary niche in our marketplace. The first rung on the property ladder is condos again for the first time in a long time, and we really hope our Gen Z and Millennial buyers take the leap!
Check out area-by-area details the full condo report.

WATERFRONT
The most affordable place to buy waterfront this quarter was Beach Dr in West Seattle at a closed sale price of $1,800,000 for 22’ of waterfront on an 11,000 sq. ft. lot. The largest piece of shoreline overall was 172 feet in Medina on Lake Washington, which commanded a sales price of $17,800,000.
This brief overview of the entire Seattle-Eastside private waterfront market, including Mercer Island and Lake Sammamish, illustrates the trends occurring in our region over time. This data is interesting and insightful but cannot replace an in-depth waterfront analysis provided by a savvy broker with years of local waterfront experience.


We earn the trust and loyalty of our brokers and clients by doing real estate exceptionally well. The leader in our market, we deliver client-focused service in an authentic, collaborative, and transparent manner and with the unmatched knowledge and expertise that comes from decades of experience.
© Copyright 2022, Windermere Real Estate/Mercer Island. Information and statistics derived from Northwest Multiple Listing Service and deemed accurate but not guaranteed.