Facebook
 X
X
 Pinterest
 Copy Link
How’s the Market? Q1 2026 Review of Seattle Area Real Estate

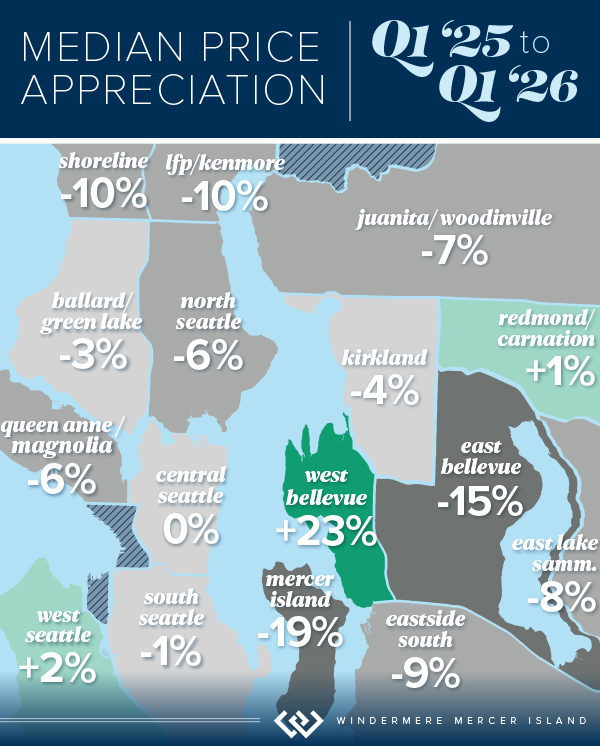
Across the region, median sales prices were lower than we saw at this time last year. The likely cause: more homes are hitting the market, but buyers (rattled by rising rates, layoffs, and an uncertain economy) aren’t keeping pace. That being said, we are still seeing many homes sell in their first 10 days on market with the choicest homes drawing multiple offers and selling above the asking price. The market is complex and every home is different…part of my job is to look beyond the averages to get a clearer understanding of what is happening at the neighborhood level.
Despite the push in interest rates, it continues to be a good time to invest and find the right home! Buyers who are up-sizing have a special advantage when prices dip since the money they save on their purchase often exceeds the lower ROI from their sale.
Click or scroll down to find your area report:
Seattle | Eastside | Mercer Island | Condos | Waterfront
SEATTLE
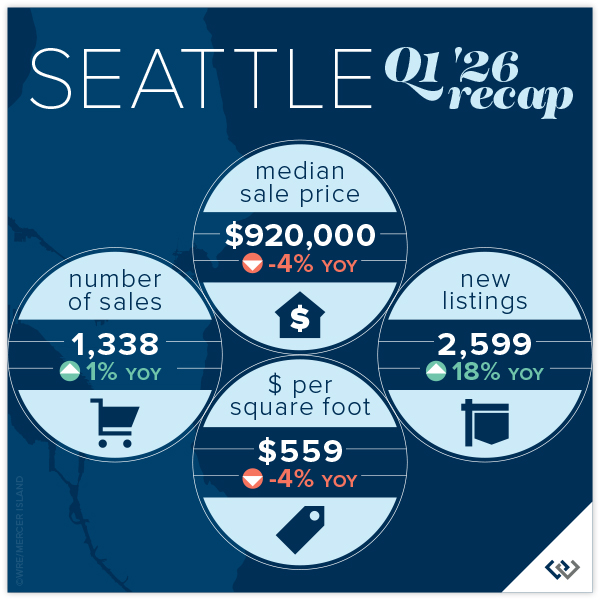
When you look past the overall data, Seattle real estate is firing on all cylinders. Even though the median price is down YOY from $958,000 in 2025 to today’s $920,000 the actual median price point is hot, in city. We’re hearing tales of multiple offers in the $800,000-$1,200,000 price range from all corners of the core Seattle neighborhoods. 67% of homes sold for at or above list price, those that sold above sold for 104% (median) over list! The entire market average list to sales price is 101%, which bodes well for gains YOY in Q2.
West Seattle and Madison Park seem to be carrying the market, the only two neighborhoods to post stable or even a modest gain in price. Maybe not so ironically, Shoreline and Lake Forest Park saw among the highest gain in overall sales volume but also the biggest losses in median price at 10%. Shoppers are savvy and know when they’ve found a deal.
While our market is facing existential pressure from things like rising interest rates, war, and talks of recession; the city hasn’t looked this beautiful in years as officials prepare for World Cup festivities in a few months. There is always a bright side, and homebuyers appear to be seeing the silver lining as they consider their long-term investment plans. If you’ve thought about selling your home in 2026, we think this could be a great year: sales are happening, 55% within the first 10 days.
Click here for the full report and neighborhood-by-neighborhood statistics!

EASTSIDE
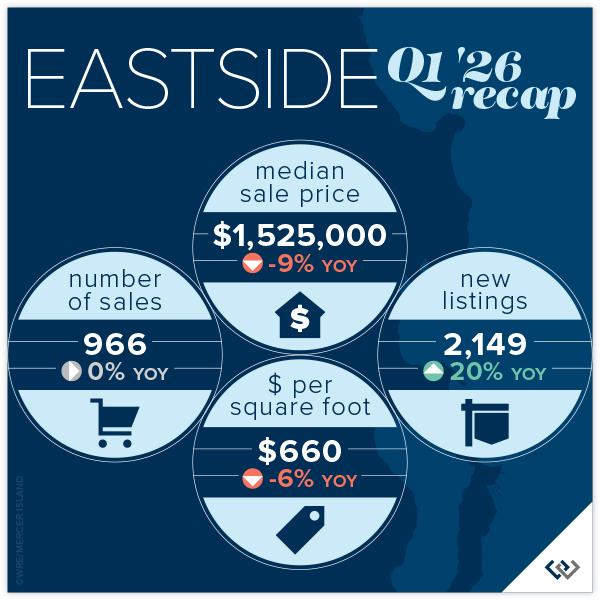
While median prices across the Eastside fell from $1,678,000 in Q1 2025 to $1,520,000, this quarter there are still bright spots. Namely, West Bellevue whose median price jumped 23% YOY. Though while the total number of sales were up in nearly every Eastside city, West Bellevue’s 36% dip drug the market down to report flat total sales: 966 at the end of Q1 2026 compared to 969 in the same period last year.
Mercer Island reported a region-wide high gain in average price per square foot at 14%, and West Bellevue was not far behind at 2%. All other neighborhoods had dips, topped by Redmond which fell 10%.
New listings rose 20% YOY, and this could mean many things but we think the two most likely are: home sellers got a head start in 2026 (we predict fewer new listings in Q2 than last year when new inventory nearly doubled from one quarter to the next) OR everyone else is as bullish about the market as we are. List to sales price ratios are at 99% on average and 51% of homes sold in the first 10 days. If you find the right home, don’t be afraid to jump.
Click here for the full report and neighborhood-by-neighborhood statistics!

MERCER ISLAND
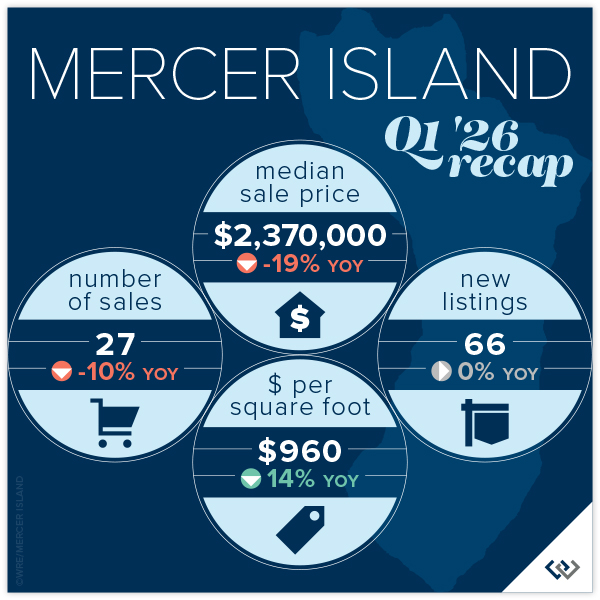
Island real estate seems to be off to a slow start in 2026 with median prices slipping YOY from $2,937,000 in 2025 to $2,370,000 in 2026. This is likely due to a spike in the months of inventory: 4.7 up from 2.9 last Q1. The months of inventory is a barometer for which way prices trend. High inventory = falling prices, supply/demand. That said, 60% of all homes sold for at or above list price and 63% sold in the first 10 days. Both of these numbers are indicators that homeowners are pricing to sell.
The condo market appears to be healthy this spring. Even though there are only 8 total sales that number is up a whopping 60% YOY. Median price is down 33%, but this is a rounding error with only 8 data points this year and 5 last year. A better indicator of market health is a 2.2 months supply of inventory, which is outpacing pretty much any segment of the market!
While our market is facing existential pressure from things like rising interest rates, war, and talks of recession; Mercer Island is now the “Bridge” in a whole new way with light rail open from Seattle to the Eastside. It will be interesting to see how this fun change affects the market as a whole.
Click here for the full report and neighborhood-by-neighborhood statistics!

CONDOS – SEATTLE & EASTSIDE
Seattle condo sales are up 8% over Q4 2025, an incredible seasonal boost. Though, the median price is down 6% YOY to $596,000. 25% of listed condos sold in the first 10 days and 48% of all condos sold for at or above list price. This tells us that agents and homeowners are tuned in to what a homebuyer in today’s market expects.
On the Eastside it’s a very similar story. Inventory is at 5.1 months. Meaning: at the current pace of sales, if no new listings came on the market, it would take nearly half a year to sell through the current inventory. That’s the highest since before 2020, the six year low was Q4 of 2021. Prices seem to reflect this, with an 11% dip in median home price down to $655,000 from Q1 2025: $740,000.
If you’ve thought about selling your condo in 2026, prepare for a highly saturated market where you’ll need to whip your unit into tip-top shape and price competitively to attract buyers. Inventory is up a combined 5%, while sales are down 21%. This is a big gap that will definitely create downward pressure on pricing if the gap between demand and supply widens. If you have the luxury to wait and watch, that might be your best option. If you’ve thought about buying, this is an excellent year to consider your options. Just remember, if you find the right nest and it hasn’t been on the market long: jump in! The good ones don’t last.
Check out area-by-area details in the full condo report.

WATERFRONT
Seattle and the Eastside both had fewer waterfront sales this quarter than we saw in Q1 of 2025, whereas Lake Sammamish posted the same number of sales and Mercer Island saw a boost. The vast majority of homes sold at or below their listed prices with the exception of one mid-century Magnolia home on 75 feet of waterfront that garnered over $300k above and beyond its original asking price.
The highest sale was in Hunts Point at $17+ million for a stunningly reimagined English Tudor on 3/4-acre with extensive waterfront. The most modest sale was in Rainier Beach: an original 1980 home on 50 feet of waterfront that went for $1,640,000.
This brief overview of the entire Seattle-Eastside private waterfront market, including Mercer Island and Lake Sammamish, illustrates the trends occurring in our region over time. This data is interesting and insightful but cannot replace an in-depth waterfront analysis with your trusted professional.
View the full waterfront report


We earn the trust and loyalty of our brokers and clients by doing real estate exceptionally well. The leader in our market, we deliver client-focused service in an authentic, collaborative, and transparent manner and with the unmatched knowledge and expertise that comes from decades of experience.
© Copyright 2026, Windermere Real Estate/Mercer Island. Information and statistics derived from Northwest Multiple Listing Service and Trendgraphix, and deemed accurate but not guaranteed.
Seattle report cover photo courtesy of The Sirianni Group; and Andrew Webb, Clarity NW Photography.
Eastside report cover photo courtesy of Tori Franzen; and Michael Tilzer Photography.
Mercer Island report cover photo courtesy of Julie Wilson; and Chris Neir, Clarity NW Photography.
Condo report cover photo courtesy of Marianne Parks; and Christopher Cooper, Clarity NW Photography.
How’s the Market? Year End Review of Seattle Area Real Estate in 2025

Home values held steady in 2025 with many communities seeing modest price gains. Seattle Metro’s median sale price and $ per sq. ft. both rose year-over-year, while the Eastside’s numbers remained similar to what we saw in 2024. Both areas saw double-digit spikes in the number of new listings and a slight slowdown in the number of sales.
Looking forward: this is a great year to invest! We’ve had a few back-to-back years of soft price gains, which feel like losses in our frequently HOT Seattle. This is as close to a “buyer’s advantage” market as we’ve seen in years. At the time of writing this, interest rates are available in the high 5’s. The cost of money is reasonable and the cost of property has not risen drastically in a few years. This is the perfect time to jump in for investors and first-time buyers. More specifically, anyone who can buy “unburdened” or without having to sell/carry two mortgages in order to buy. The condo and townhome markets continue to be a great opportunity for those looking to take the first step onto the property ladder. If none of this applies to you, remember: if you’re looking to buy and sell within the same market, you only get an advantage on one side.
Click or scroll down to find your area report:
Seattle | Eastside | Mercer Island | Condos | Waterfront
SEATTLE
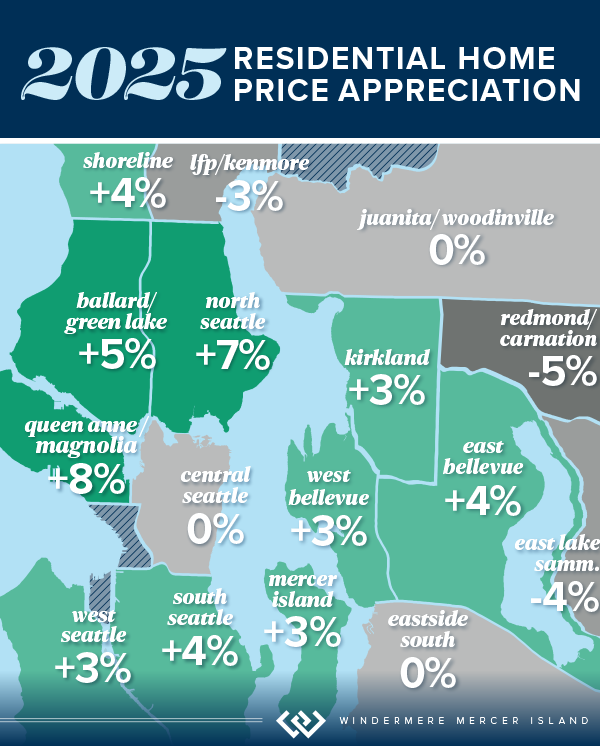
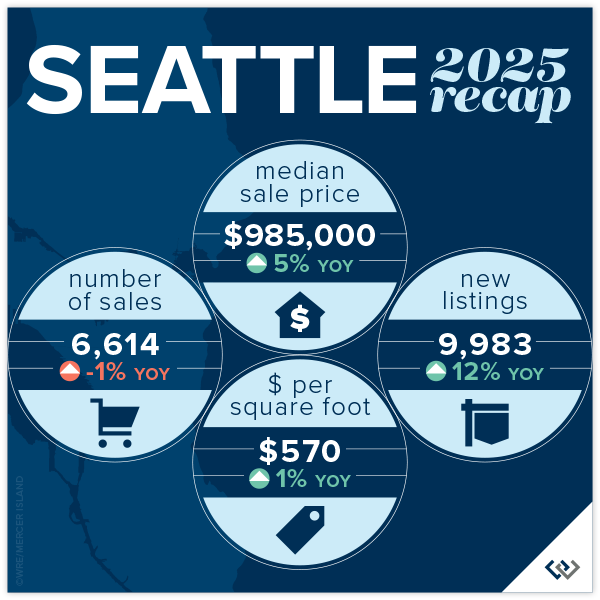
It’s all good news in the city of Seattle! The median price rose by 5% to $985,000. Pricing remained competitive, with 64% of homes selling at or above their list price (despite the fact that new listings increased 12% from 2024 and the number of sales dipped slightly).
Sales activity moved quickly in many neighborhoods. Citywide, 55% of homes sold within the first 10 days on market. Several areas posted strong performance, including Ballard & Green Lake with 1,705 homes sold, and North Seattle with 1,040 sales. Median prices varied by neighborhood, ranging from $794,000 in South Seattle to $1,399,000 in Queen Anne & Magnolia, reflecting the diversity of Seattle’s housing market.
Remember, these statistics include new construction data. In an inventory-constricted market, new construction data can skew pricing stats significantly. Check with your agent for how this affects your neighborhood.
Click here for the full report and neighborhood-by-neighborhood statistics!

EASTSIDE
Across the Greater Eastside, 5,458 homes sold during the year, down 5% compared to 2024. New inventory increased, with 8,259 new listings coming to market—up 16%! Fifty-five percent of homes sold at or above their list price, and 53% sold within the first 10 days on market, highlighting consistent transaction pace and buyer confidence across the region. Despite this, the median sale price held flat at $1,599,000 compared to 2024, while homes sold for an average of $688 per square foot, also similar to last year.
Several communities recorded notable activity levels, including Woodinville with 1,235 homes sold and East of Lake Sammamish with 1,134 sales. East Bellevue saw a 13% increase in homes sold, while Redmond posted a 15% increase in sales volume. Median sale prices varied by community, ranging from $1,281,000 in Woodinville to $3,688,000 in West Bellevue, reflecting the diversity of the Eastside housing market.
Several communities recorded notable activity levels, including Woodinville with 1,235 homes sold and East of Lake Sammamish with 1,134 sales. East Bellevue saw a 13% increase in homes sold, while Redmond posted a 15% increase in sales volume. Median sale prices varied by community, ranging from $1,281,000 in Woodinville to $3,688,000 in West Bellevue, reflecting the diversity of the Eastside housing market.

Click here for the full report and neighborhood-by-neighborhood statistics!

MERCER ISLAND
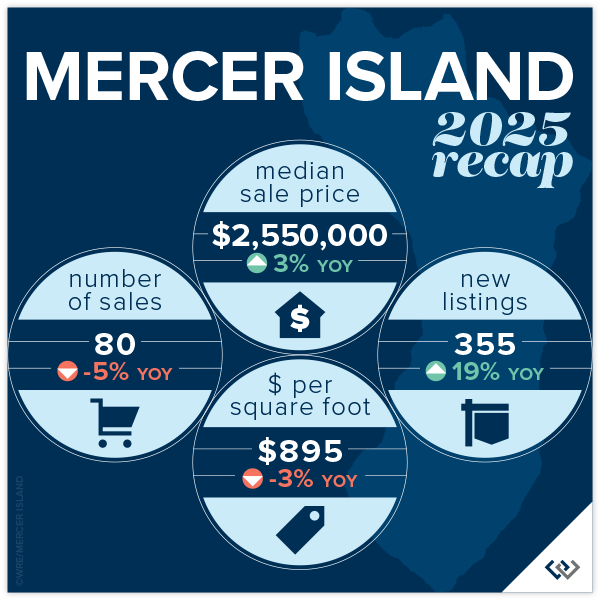
The 2025 Mercer Island real estate data reflects a year of steady activity and modest price gains. Median home prices rose 3% year over year to $2,550,000. Homes sold for an average of $895 per square foot, and half of all homes sold at or above their list price. Sales moved efficiently, with 56% of homes selling within the first 10 days on market.
A total of 80 single-family homes sold on Mercer Island during the year. Activity varied by neighborhood, with sales recorded across Northend, Southend, Mid-Island, First Hill, Westside, and The Lakes. Median home prices ranged from $1,775,000 in Mercerdale to $5,831,000 on the Westside, highlighting the range of housing options across the island.
Click here for the full report and neighborhood-by-neighborhood statistics!

CONDOS – SEATTLE & EASTSIDE
The 2025 Condo Report shows steady, encouraging activity across both the Seattle and Eastside condo markets. Year over year, condo sale prices increased a combined 2% to a median of $630,000, with homes selling for an average of $633/sq.ft. Half of all condos sold at or above their list price, signaling stable buyer demand. Inventory also expanded, with 8,331 new condo listings—up 14% from 2024! This is great news, increased supply that didn’t cause a price ‘dump’, it shows our Buyers may be returning to confidence around condos.
In Seattle, 2,695 condos sold during the year, a 9% increase in sales volume. The median Seattle condo price rose 2% to $585,000, and 51% of homes sold at or above list price. On the Eastside, 2,050 condos sold, with median prices increasing 5% year over year to $730,000. Eastside condos averaged $643 per square foot, with 51% selling at or above list price and 36% selling within the first 10 days. The market showed a combined 52 average days on market, with a 99% list to sales price ratio. Though, when original list to sales price ratio is compared the average sits at 97%. This means that patience and active calibration are both required when marketing your condo.
Mercer Island’s condo market also trucked along with 27 sales and a slight 1% year-over-year boost in median prices. Condos sold for an average of $591 per square foot, up 13% over 2024. Thirty-seven percent of condos sold at or above list price, and within the first 10 days. Inventory expanded as well, with 355 new condo listings, up 19% from 2024.
Check out area-by-area details in the full condo report.

WATERFRONT
Seattle saw a boost in the number of waterfront sales in 2025, with 36 compared to 31 in 2024. Lake Sammamish sales were similar to last year (31 vs. 30 in 2024), while Mercer Island and the Eastside both saw slight dips their sales numbers.
Mercer Island had the highest waterfront sale of the year at $25 million for a nearly 10,000 sq. ft. European Modern home on 102 feet of prime west-facing North End waterfront. The most modest sale was in Bellevue at $1.75 million for an original 1960s beach house on 50 feet of lakefront.
This brief overview of the entire Seattle-Eastside private waterfront market, including Mercer Island and Lake Sammamish, illustrates the trends occurring in our region over time. This data is interesting and insightful but cannot replace an in-depth waterfront analysis with your trusted professional.
View the full waterfront report

We earn the trust and loyalty of our brokers and clients by doing real estate exceptionally well. The leader in our market, we deliver client-focused service in an authentic, collaborative, and transparent manner and with the unmatched knowledge and expertise that comes from decades of experience.
© Copyright 2026, Windermere Real Estate/Mercer Island. Information and statistics derived from Northwest Multiple Listing Service and Trendgraphix, and deemed accurate but not guaranteed.
Housing Forecast: 6 Predictions for 2026

The following is a summary of Windermere Principal Economist Jeff Tucker’s six predictions for the U.S. housing market and economy in 2026. He goes into more detail about his predictions in the video below.
1. Existing Home Sales Will Pick Up (Barely)
Home sales have hovered near generational lows for three years. While a sharp rebound is unlikely, conditions point to a modest uptick in 2026. Inventory levels are higher than they’ve been since 2019, and mortgage rates are lower than they’ve been since 2022. Together, those factors should lift existing home sales—but not by much.
2. Home Prices Will Be Roughly Flat
Home prices are likely to remain flat in 2026, largely due to higher inventory putting downward pressure on values. The Case-Shiller Home Price Index showed small declines last summer, though that trend faded by fall. Sellers have been highly responsive to market shifts, often de-listing when offers fall short or holding off on listing altogether. That restraint has kept prices from falling further despite growing supply
3. Inventory Will Climb to Pre-Pandemic Levels
The number of homes for sale will likely return to pre-pandemic levels in 2026, possibly as early as spring. Inventory rose sharply in 2025, and a “shadow supply” of homes—those whose owners are waiting for better conditions—remains in the wings. Many “discretionary sellers” will continue testing the market, holding out for the right price. That behavior should extend average time on market and boost total listings, giving buyers more options and negotiating power.
4. The Homeownership Rate Will Decline
At current prices and interest rates, homeownership remains out of reach for many middle-class Americans who would have bought in different conditions. Slower rent growth has also reduced urgency among would-be buyers, encouraging them to stay put. More renters are opting for single-family homes to enjoy the space and lifestyle of ownership without a mortgage, a shift that will help push the overall homeownership rate slightly lower.
5. Mortgage Rates Will Decline Slightly
Mortgage rates should remain below 6.25% for most of 2026 and could briefly dip under 6%. The Fed’s rate cuts and slower growth have brought 10-year Treasury yields near 4%, while the spread between Treasuries and mortgage rates has narrowed toward its normal range of 2% or less. That trend is expected to continue as refinance risk on mortgage-backed securities gradually fades, but much of the improvement is already reflected in current rates, so significant declines are unlikely.
6. We Will Avoid a Recession in 2026
The U.S. economy weathered several shocks in 2025 but avoided a downturn. Payroll gains have slowed, though more due to shrinking labor supply than weak demand, and unemployment claims have remained stable. After early trade policy turbulence, corporate earnings rebounded strongly, and tariff concerns have faded as court challenges and new trade deals rolled back some of the costliest restrictions.
This article originally appeared on the Windermere blog December 2, 2025.
We earn the trust and loyalty of our brokers and clients by doing real estate exceptionally well. The leader in our market, we deliver client-focused service in an authentic, collaborative, and transparent manner and with the unmatched knowledge and expertise that comes from decades of experience.
© Copyright 2025, Windermere Real Estate/Mercer Island.
Top 10 Predictions for 2024 Real Estate

Will 2024 be a good year for real estate? This question comes up a LOT, especially from those who are considering buying or selling a home in the near future. Housing economist Matthew Gardner weighed in with his top 10 predictions for what the real estate market will look like in the coming year. Here is what he had to say…
1. Still no housing bubble
This was number one on my list last year and, so far, my forecast was spot on. The reason why I’m calling it out again is because the market performed better in 2023 than I expected. Continued price growth, combined with significantly higher mortgage rates, might suggest to some that the market will implode in 2024, but I find this implausible.
2. Mortgage rates will drop, but not quickly
The U.S. economy has been remarkably resilient, which has led the Federal Reserve to indicate that they will keep mortgage rates higher for longer to tame inflation. But data shows inflation and the broader economy are starting to slow, which should allow mortgage rates to ease in 2024. That said, I think rates will only fall to around 6% by the end of the year.
3. Listing activity will rise modestly
Although I expect a modest increase in listing activity in 2024, many homeowners will be hesitant to sell and lose their current mortgage rate. The latest data shows 80% of mortgaged homeowners in the U.S. have rates at or below 5%. Although they may not be inclined to sell right now, when rates fall to within 1.5% of their current rate, some will be motivated to move.
4.Home prices will rise, but not much
While many forecasters said home prices would fall in 2023, that was not the case, as the lack of inventory propped up home values. Given that it’s unlikely that there will be a significant increase in the number of homes for sale, I don’t expect prices to drop in 2024. However, growth will be a very modest 1%, which is the lowest pace seen for many years, but growth all the same.
5. Home values in markets that crashed will recover
During the pandemic there were a number of more affordable markets across the country that experienced significant price increases, followed by price declines post-pandemic. I expected home prices in those areas to take longer to recover than the rest of the nation, but I’m surprised by how quickly they have started to grow, with most markets having either matched their historic highs or getting close to it – even in the face of very high borrowing costs. In 2024, I expect prices to match or exceed their 2022 highs in the vast majority of metro areas across the country.
6. New construction will gain market share
Although new construction remains tepid, builders are benefiting from the lack of supply in the resale market and are taking a greater share of listings. While this might sound like a positive for builders, it’s coming at a cost through lower list prices and increased incentives such as mortgage rate buy downs. Although material costs have softened, it will remain very hard for builders to deliver enough housing to meet the demand.
7. Housing affordability will get worse
With home prices continuing to rise and the pace of borrowing costs far exceeding income growth, affordability will likely erode further in 2024. For affordability to improve, it would require either a significant drop in home values, a significant drop in mortgage rates, a significant increase in household incomes, or some combination of the three. But I’m afraid this is very unlikely. First-time home buyers will be the hardest hit by this continued lack of affordable housing.
8. Government needs to continue taking housing seriously
The government has started to take housing and affordability more seriously, with several states already having adopted new land use policies aimed at releasing developable land. In 2024, I hope cities and counties will continue to ease their restrictive land use policies. I also hope they’ll continue to streamline the permitting process and reduce the fees that are charged to builders, as these costs are passed directly onto the home buyer, which further impacts affordability.
9. Foreclosure activity won’t impact the market
Many expected that the end of forbearance would bring a veritable tsunami of homes to market, but that didn’t happen. At its peak, almost 1-in-10 homes in America were in the program, but that has fallen to below 1%. That said, foreclosure starts have picked up, but still remain well below pre-pandemic levels. Look for delinquency levels to continue rising in 2024, but they will only be returning to the long-term average and are not a cause for concern.
10. Sales will rise but remain the lowest in 15 years
2023 will likely be remembered as the year when home sales were the lowest since the housing bubble burst in 2008. I expect the number of homes for sale to improve modestly in 2024 which, combined with mortgage rates trending lower, should result in about 4.4 million home sales. Ultimately though, demand exceeding supply will mean that sellers will still have the upper hand.
About Matthew Gardner
Matthew Gardner analyzes and interprets economic data and its impact on the real estate market on both a local and national level. Matthew has over 30 years of professional experience both in the U.S. and U.K.
Matthew also sits on the Washington State Governors Council of Economic Advisors; chairs the Board of Trustees at the Washington Center for Real Estate Research at the University of Washington; and is an Advisory Board Member at the Runstad Center for Real Estate Studies at the University of Washington where he also lectures in real estate economics.
Adapted from an article that originally appeared on the Windermere blog December 4th, 2023. Written by: Matthew Gardner.
We earn the trust and loyalty of our brokers and clients by doing real estate exceptionally well. The leader in our market, we deliver client-focused service in an authentic, collaborative, and transparent manner and with the unmatched knowledge and expertise that comes from decades of experience.
Q4 2022 Western Washington Economic & Real Estate Update

The following analysis of select counties of the Western Washington real estate market is provided by Windermere Real Estate Chief Economist Matthew Gardner. I hope that this information may assist you with making better-informed real estate decisions. For further information about the housing market in your area, please don’t hesitate to contact me.
Regional Economic Overview
Although the job market in Western Washington continues to grow, the pace has started to slow. The region added over 91,000 new jobs during the past year, but the 12-month growth rate is now below 100,000, a level we have not seen since the start of the post-COVID job recovery. That said, all but three counties have recovered completely from their pandemic job losses and total regional employment is up more than 52,000 jobs. The regional unemployment rate in November was 3.8%, which was marginally above the 3.7% level of a year ago. Many business owners across the country are pondering whether we are likely to enter a recession this year. As a result, it’s very possible that they will start to slow their expansion in anticipation of an economic contraction.
Western Washington Home Sales
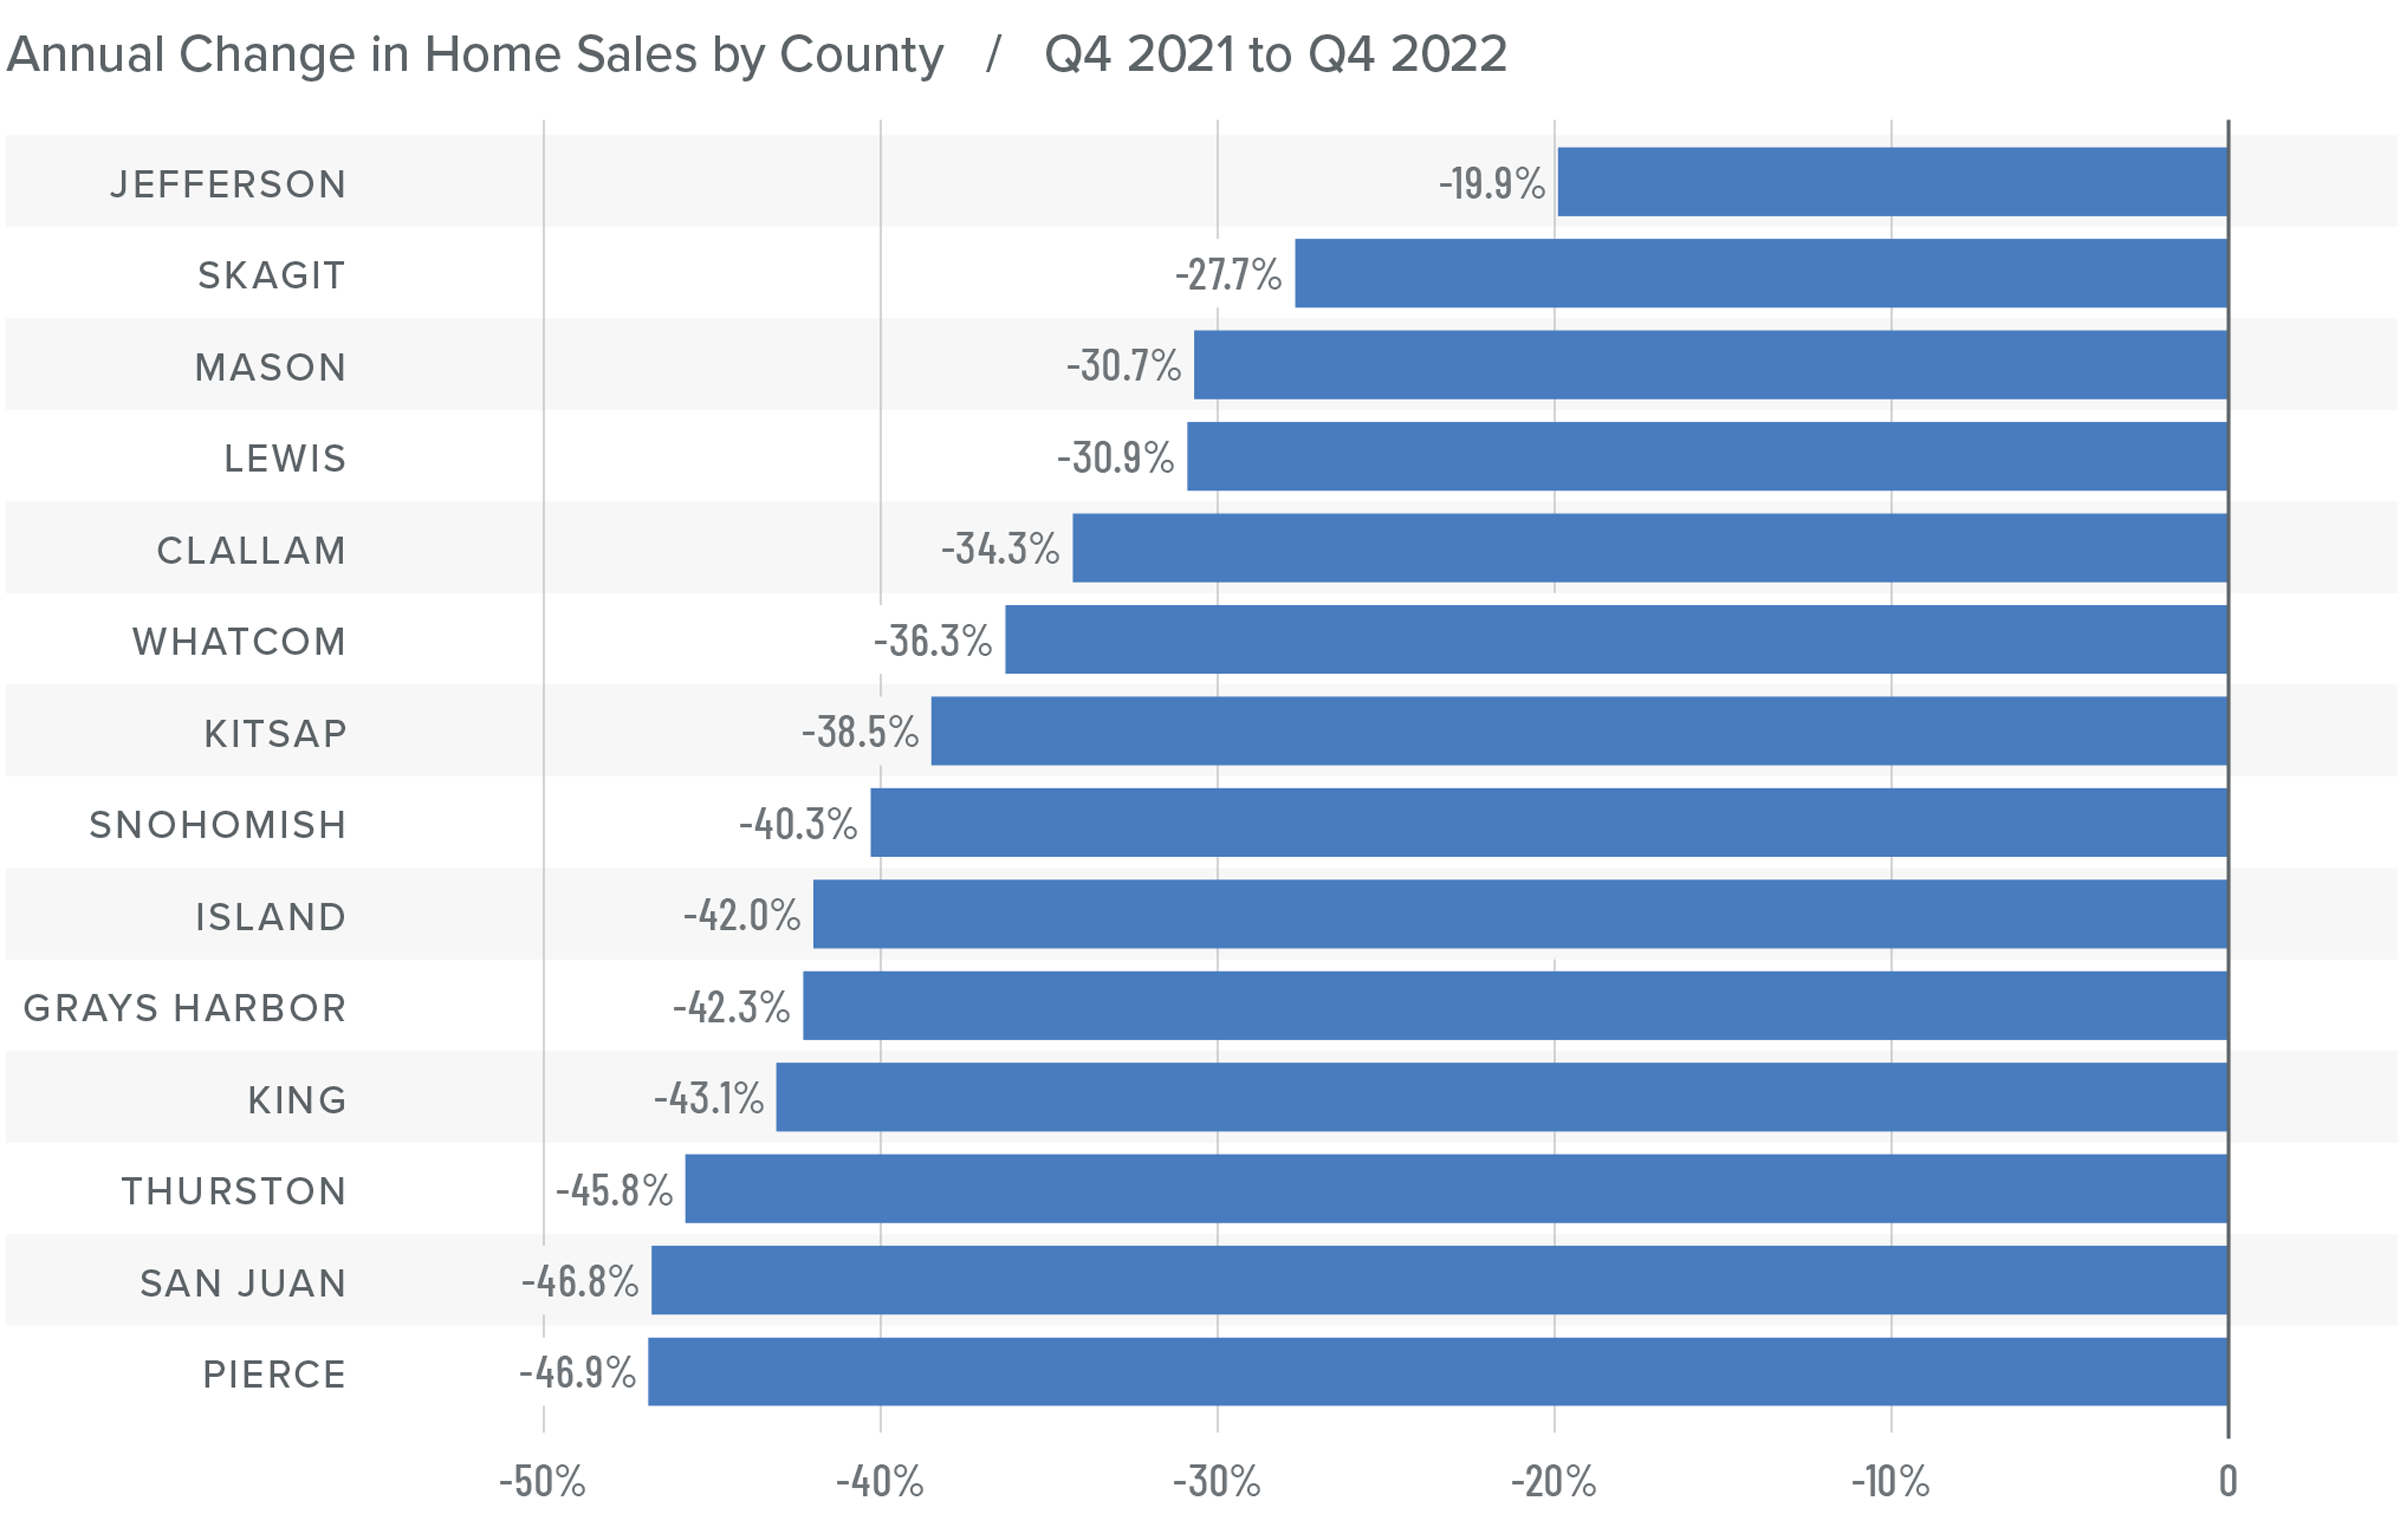
❱ In the final quarter of 2022, 12,711 homes sold, representing a drop of 42% from the same period in 2021. Sales were 34.7% lower than in the third quarter of 2022.
❱ Listing activity rose in every market year over year but fell more than 26% compared to the third quarter, which is expected given the time of year.
❱ Home sales fell across the board relative to the fourth quarter of 2021 and the third quarter of 2022.
❱ Pending sales (demand) outpaced listings (supply) by a factor of 1:2. This was down from 1:6 in the third quarter. That ratio has been trending lower for the past year, which suggests that buyers are being more cautious and may be waiting for mortgage rates to drop.
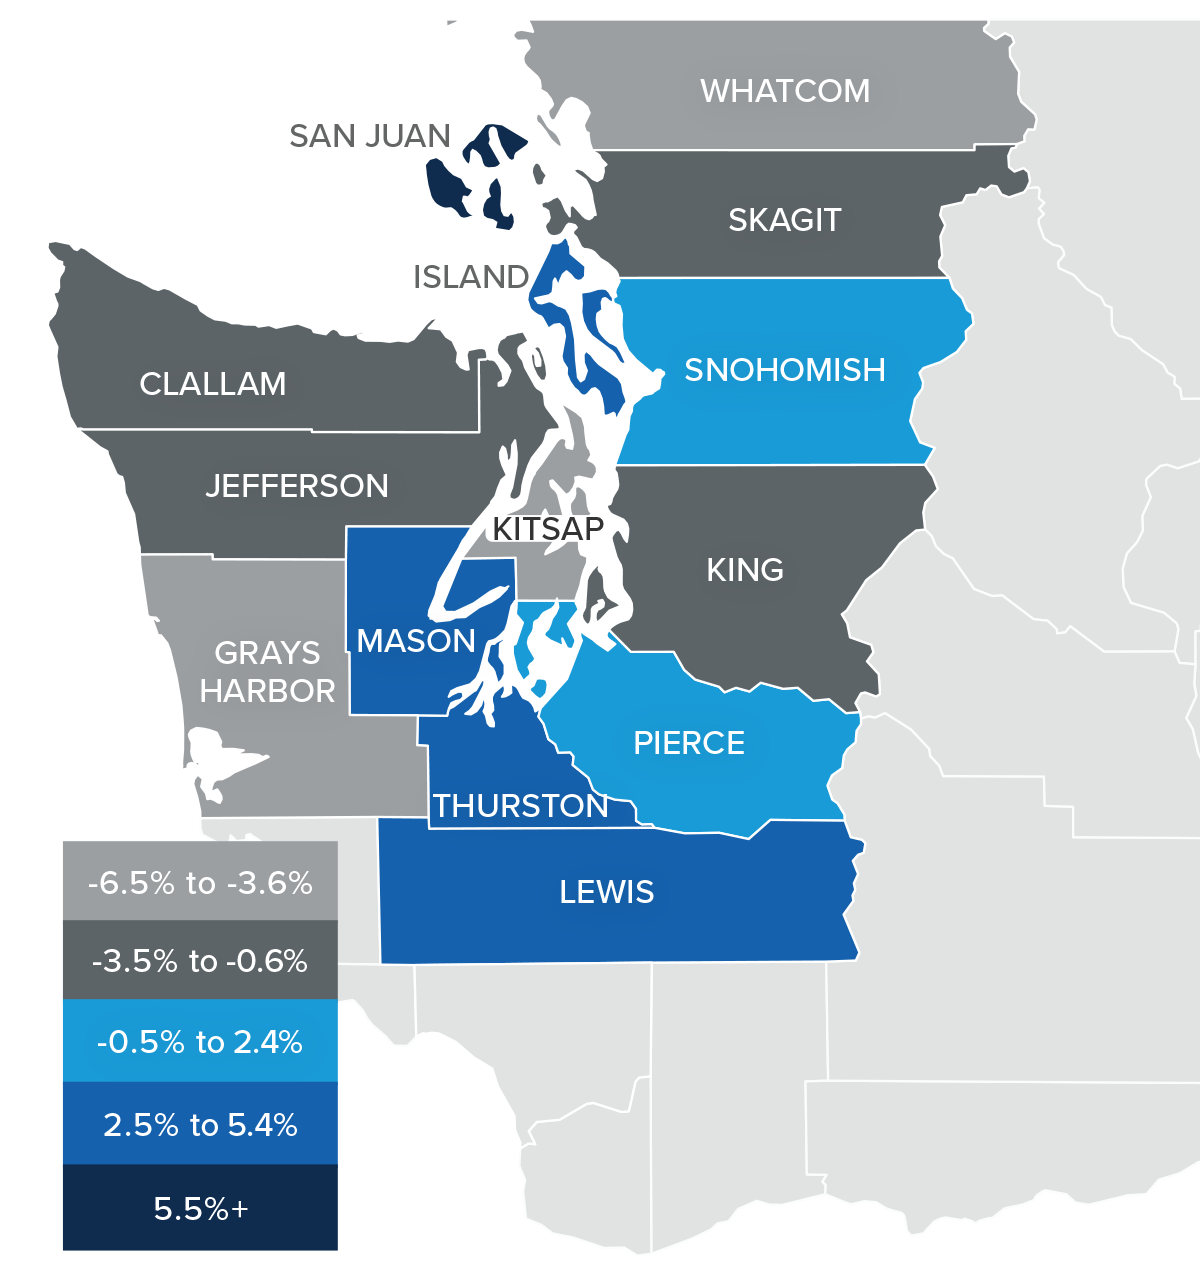
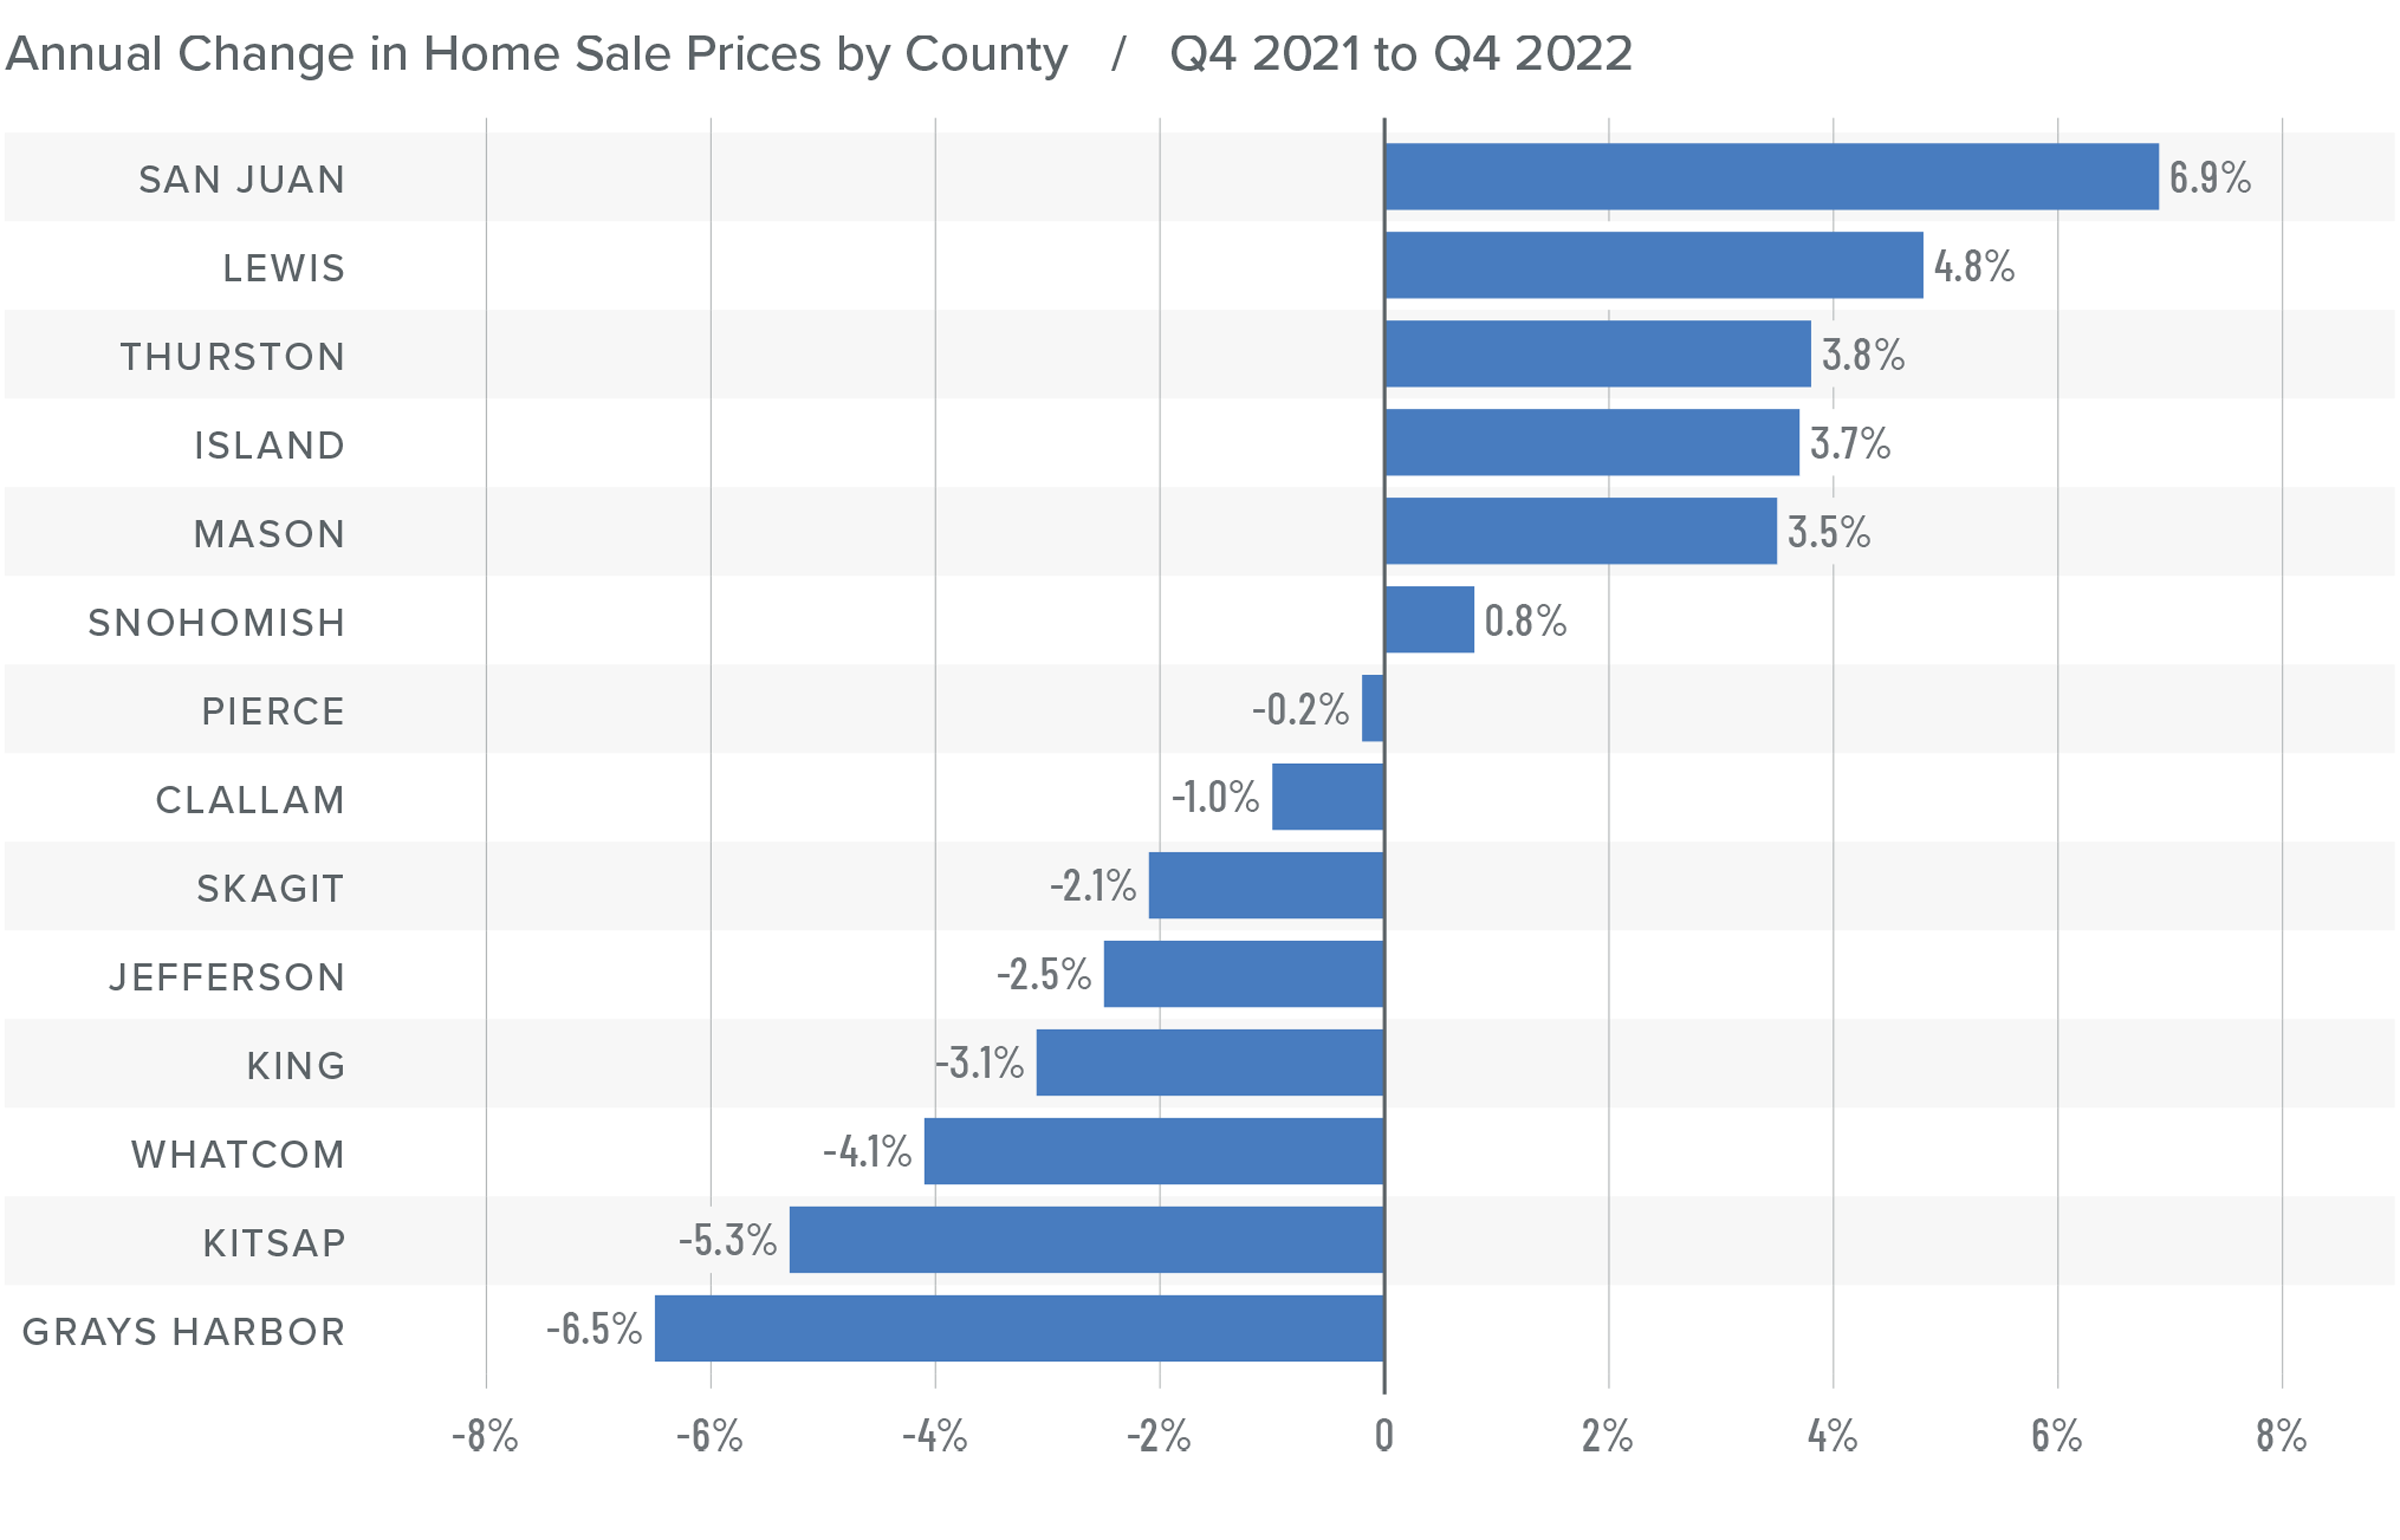
Western Washington Home Prices
❱ Sale prices fell an average of 2% compared to the same period the year prior and were 6.1% lower than in the third quarter of 2022. The average sale price was $702,653.
❱ The median listing price in the fourth quarter of 2022 was 5% lower than in the third quarter. Only Skagit County experienced higher asking prices. Clearly, sellers are starting to be more realistic about the shift in the market.
❱ Even though the region saw aggregate prices fall, prices rose in six counties year over year.
❱ Much will be said about the drop in prices, but I am not overly concerned. Like most of the country, the Western Washington market went through a period of artificially low borrowing costs, which caused home values to soar. But now prices are trending back to more normalized levels, which I believe is a good thing.
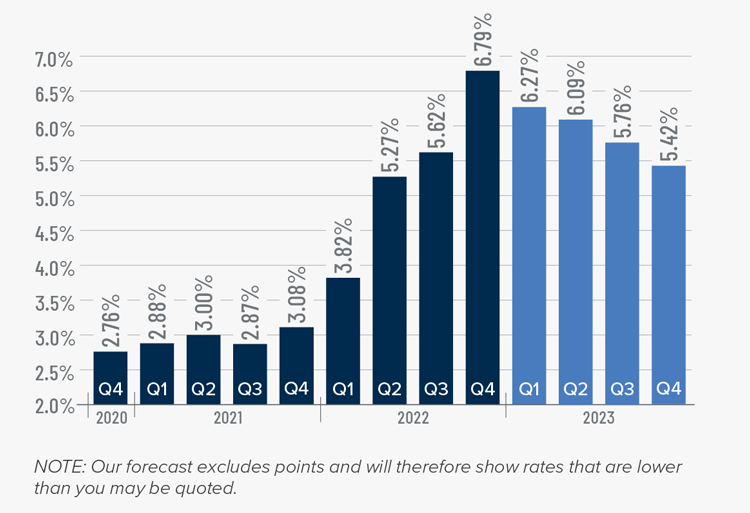
Mortgage Rates
Rates rose dramatically in 2022, but I believe that they have now peaked. Mortgage rates are primarily based on the prices and yields of bonds, and while bonds take cues from several places, they are always impacted by inflation and the economy at large. If inflation continues to fall, as I expect it will, rates will continue to drop.
My current forecast is that mortgage rates will trend lower as we move through the year. While this may be good news for home buyers, rates will still be higher than they have become accustomed to. Even as the cost of borrowing falls, home prices in expensive markets such as Western Washington will probably fall a bit more to compensate for rates that will likely hold above 6% until early summer.
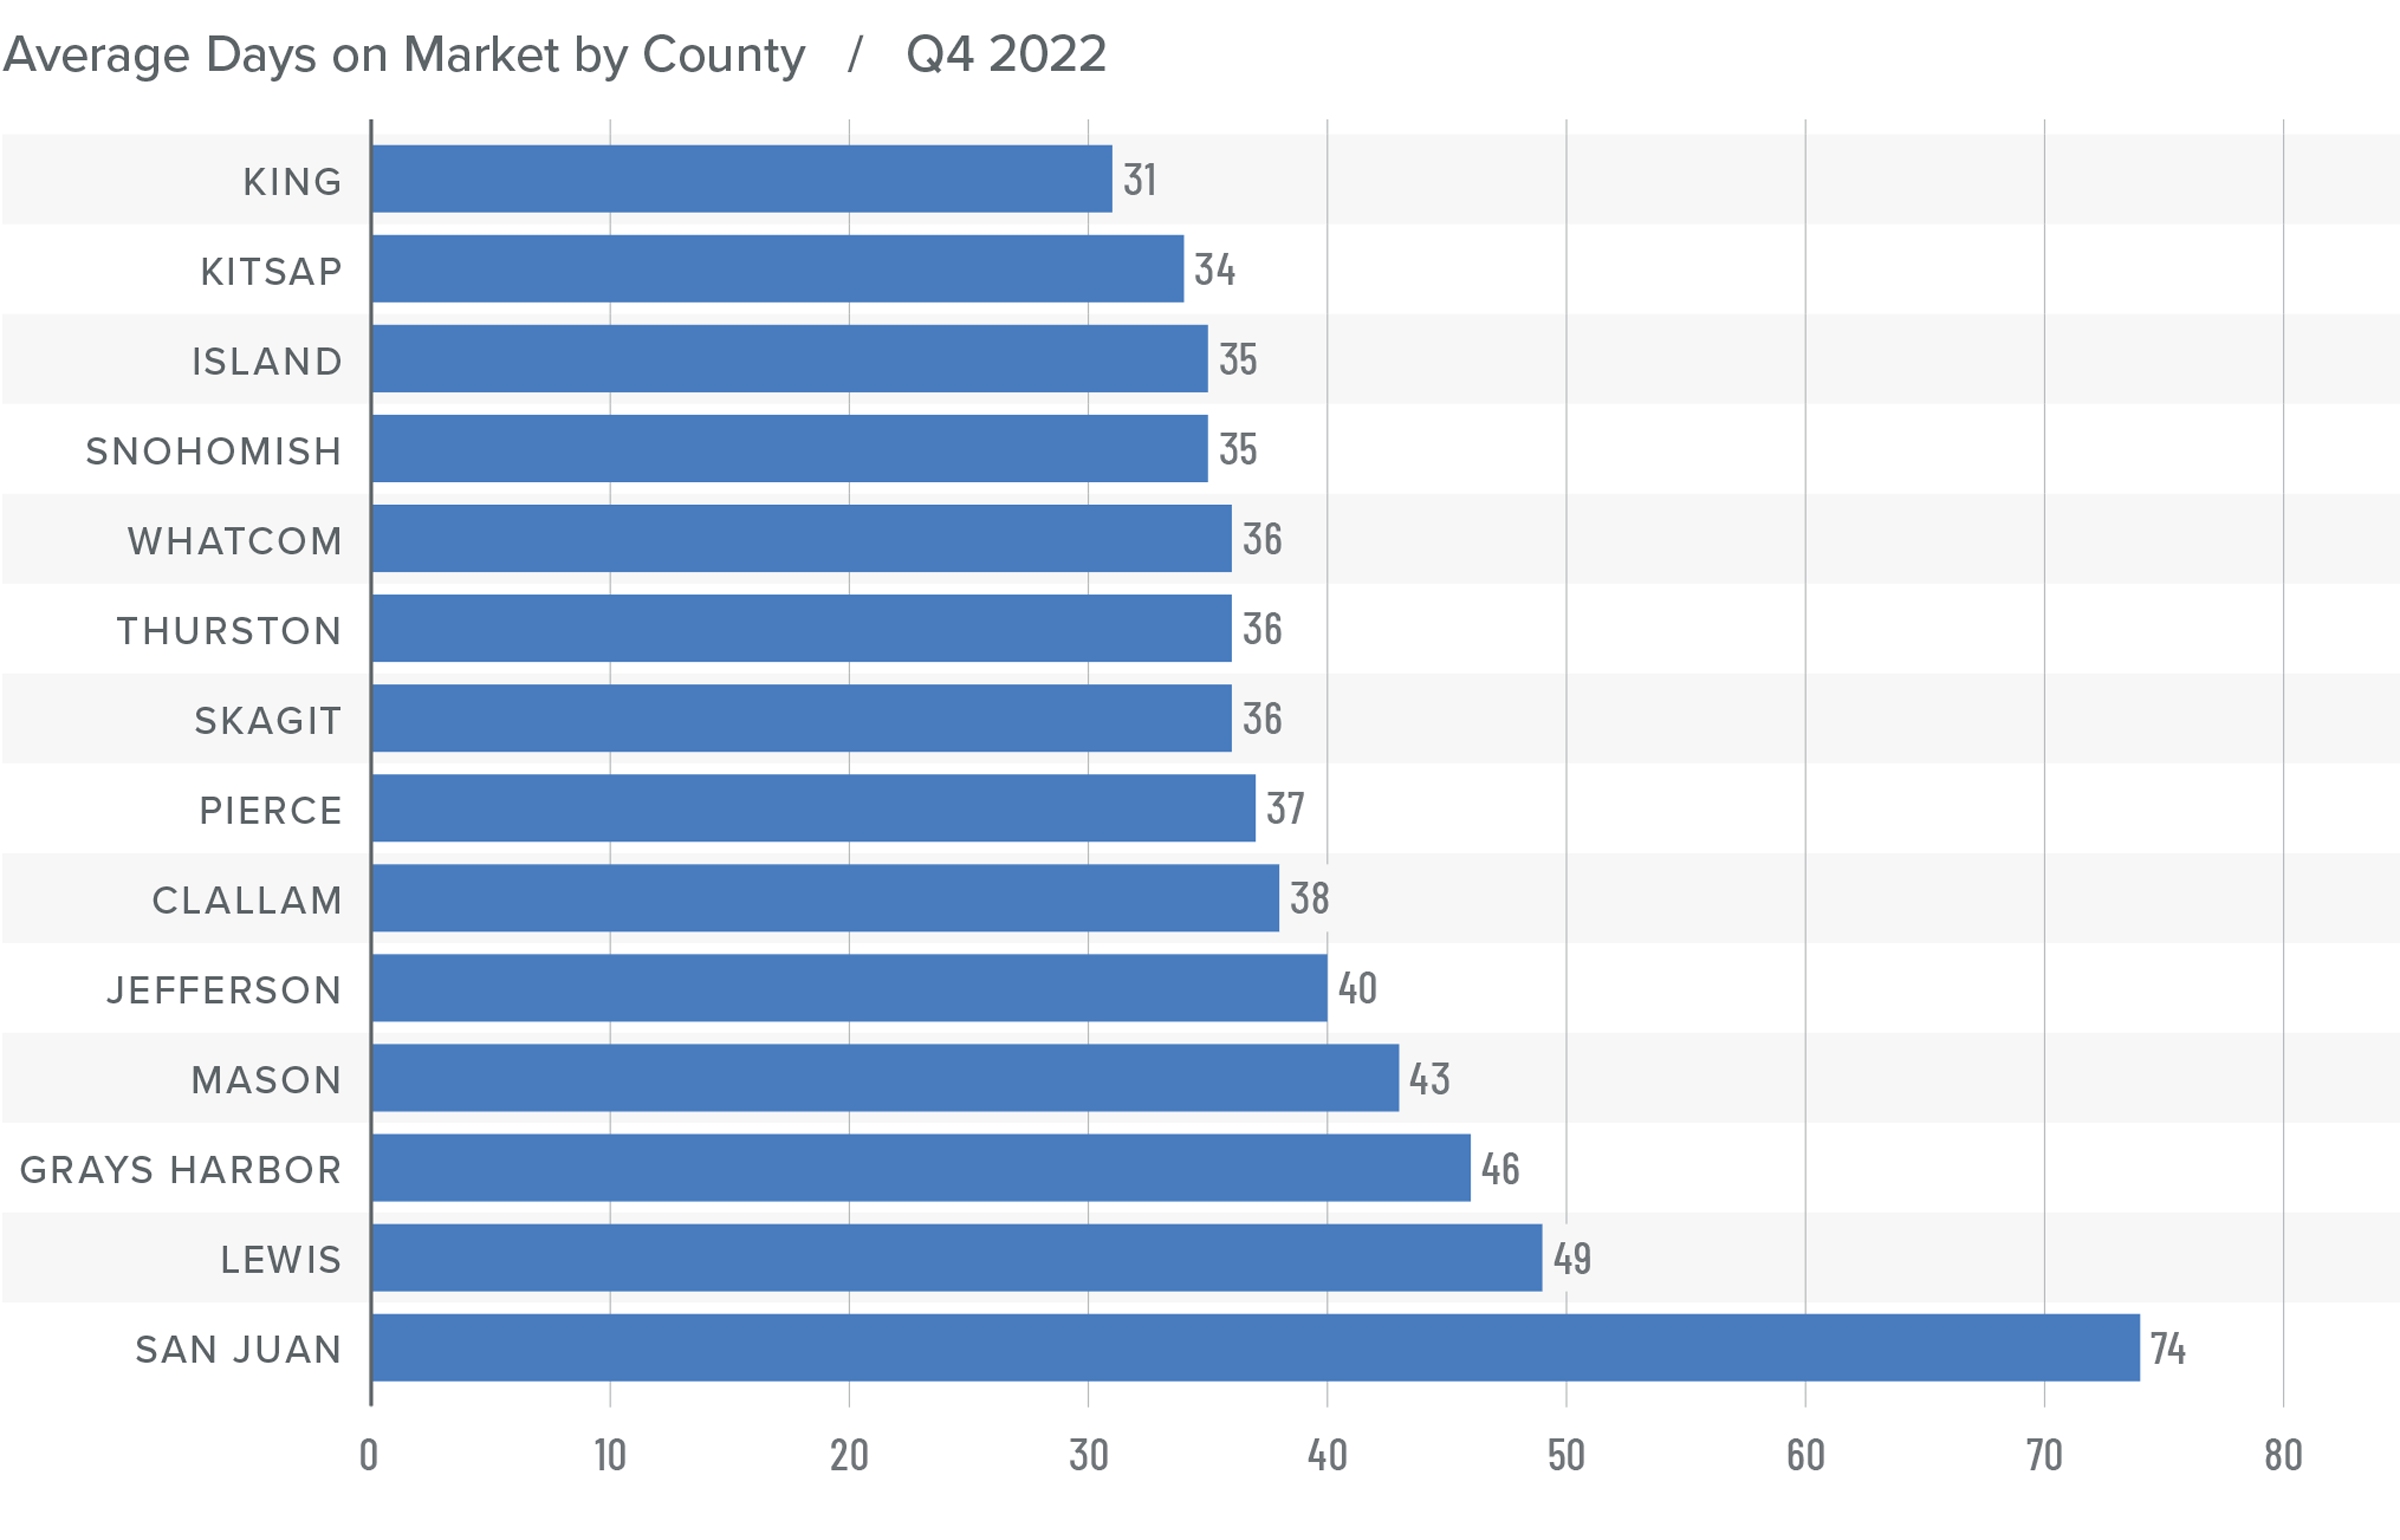
Western Washington Days on Market
❱ It took an average of 41 days for homes to sell in the fourth quarter of 2022. This was 17 more days than in the same quarter of 2021, and 16 days more than in the third quarter of 2022.
❱ King County was again the tightest market in Western Washington, with homes taking an average of 31 days to find a buyer.
❱ All counties contained in this report saw the average time on market rise from the same period a year ago.
❱ Year over year, the greatest increase in market time was Snohomish County, where it took an average of 23 more days to find a buyer. Compared to the third quarter of 2022, San Juan County saw average market time rise the most (from 34 to 74 days).
Conclusions
This speedometer reflects the state of the region’s real estate market using housing inventory, price gains, home sales, interest rates, and larger economic factors.
The regional economy is still growing, but it is showing signs of slowing. Although this is not an immediate concern, if employees start to worry about job security, they may decide to wait before making the decision to buy or sell a home. As we move through the spring I believe the market will be fairly soft, but I would caution buyers who think conditions are completely shifting in their direction. Due to the large number of homeowners who have a mortgage at 3% or lower, I simply don’t believe the market will become oversupplied with inventory, which will keep home values from dropping too significantly.

Ultimately, however, the market will benefit buyers more than sellers, at least for the time being. As such, I have moved the needle as close to the balance line as we have seen in a very long time.
About Matthew Gardner

As Chief Economist for Windermere Real Estate, Matthew Gardner is responsible for analyzing and interpreting economic data and its impact on the real estate market on both a local and national level. Matthew has over 30 years of professional experience both in the U.S. and U.K.
In addition to his day-to-day responsibilities, Matthew sits on the Washington State Governors Council of Economic Advisors; chairs the Board of Trustees at the Washington Center for Real Estate Research at the University of Washington; and is an Advisory Board Member at the Runstad Center for Real Estate Studies at the University of Washington where he also lectures in real estate economics.
This article originally appeared on the Windermere blog January 26th, 2023. Written by: Matthew Gardner.

© Copyright 2023, Windermere Real Estate/Mercer Island.
Matthew Gardner’s Top 10 Predictions for 2023

This video shows Windermere Chief Economist Matthew Gardner’s Top 10 Predictions for 2023. Each month, he analyzes the most up-to-date U.S. housing data to keep you well-informed about what’s going on in the real estate market.
1. There Is No Housing Bubble
Mortgage rates rose steeply in 2022 which, when coupled with the massive run-up in home prices, has some suggesting that we are recreating the housing bubble of 2007. But that could not be further from the truth.
Over the past couple of years, home prices got ahead of themselves due to a perfect storm of massive pandemic-induced demand and historically low mortgage rates. While I expect year-over-year price declines in 2023, I don’t believe there will be a systemic drop in home values. Furthermore, as financing costs start to pull back in 2023, I expect that will allow prices to resume their long-term average pace of growth.
2. Mortgage Rates Will Drop
Mortgage rates started to skyrocket at the start of 2022 as the Federal Reserve announced their intent to address inflation. While the Fed doesn’t control mortgage rates, they can influence them, which we saw with the 30-year rate rising from 3.2% in early 2022 to over 7% by October.
Their efforts so far have yet to significantly reduce inflation, but they have increased the likelihood of a recession in 2023. Therefore, early in the year I expect the Fed to start pulling back from their aggressive policy stance, and this will allow rates to begin slowly stabilizing. Rates will remain above 6% until the fall of 2023 when they should dip into the high 5% range. While this is higher than we have become used to, it’s still more than 2% lower than the historic average.
3. Don’t Expect Inventory to Grow Significantly
Although inventory levels rose in 2022, they are still well below their long-term average. In 2023 I don’t expect a significant increase in the number of homes for sale, as many homeowners do not want to lose their low mortgage rate. In fact, I estimate that 25-30 million homeowners have mortgage rates around 3% or lower. Of course, homes will be listed for sale for the usual reasons of career changes, death, and divorce, but the 2023 market will not have the normal turnover in housing that we have seen in recent years.
4. No Buyer’s Market But a More Balanced One
With supply levels expected to remain well below normal, it’s unlikely that we will see a buyer’s market in 2023. A buyer’s market is usually defined as having more than six months of available inventory, and the last time we reached that level was in 2012 when we were recovering from the housing bubble. To get to six months of inventory, we would have to reach two million listings, which hasn’t happened since 2015. In addition, monthly sales would have to drop below 325,000, a number we haven’t seen in over a decade. While a buyer’s market in 2023 is unlikely, I do expect a return to a far more balanced one.
5. Sellers Will Have to Become More Realistic
We all know that home sellers have had the upper hand for several years, but those days are behind us. That said, while the market has slowed, there are still buyers out there. The difference now is that higher mortgage rates and lower affordability are limiting how much buyers can pay for a home. Because of this, I expect listing prices to pull back further in the coming year, which will make accurate pricing more important than ever when selling a home.
6. Workers Return to Work (Sort of)
The pandemic’s impact on where many people could work was profound, as it allowed buyers to look further away from their workplaces and into more affordable markets. Many businesses are still determining their long-term work-from-home policies, but in the coming year I expect there will be more clarity for workers. This could be the catalyst for those who have been waiting to buy until they know how often they’re expected to work at the office.
7. New Construction Activity Is Unlikely to Increase
Permits for new home construction are down by over 17% year over year, as are new home starts. I predict that builders will pull back further in 2023, with new starts coming in at a level we haven’t seen since before the pandemic.
Builders will start seeing some easing in the supply chain issues that hit them hard over the past two years, but development costs will still be high. Trying to balance homebuilding costs with what a consumer can pay (given higher mortgage rates) will likely lead builders to slow activity. This will actually support the resale market, as fewer new homes will increase the demand for existing homes.
8. Not All Markets Are Created Equal
Markets where home price growth rose the fastest in recent years are expected to experience a disproportionate swing to the downside. For example, markets in areas that had an influx of remote workers, who flocked to cheaper housing during the pandemic, will likely see prices fall by a greater percentage than other parts of the country. That said, even those markets will start to see prices stabilize by the end of 2023 and resume a more reasonable pace of price growth.
9. Affordability Will Continue to Be a Major Issue
In most markets, home prices will not increase in 2023, but any price drop will not be enough to make housing more affordable. And with mortgage rates remaining higher than they’ve been in over a decade, affordability will continue to be a problem in the coming year, which is a concerning outlook for first-time buyers.
Over the past two years, many renters have had aspirations of buying but the timing wasn’t quite right for them. With both prices and mortgage rates spiraling upward in 2022, it’s likely that many renters are now in a situation where the dream of homeownership has gone. That’s not to say they will never be able to buy a home, just that they may have to wait a lot longer than they had hoped.
10. Government Needs to Take Housing More Seriously
Over the past two years, the market has risen to such an extent that it has priced out millions of potential home buyers. With a wave of demand coming from Millennials and Gen Z, the pace of housing production must increase significantly, but many markets simply don’t have enough land to build on. This is why I expect more cities, counties, and states to start adjusting their land use policies to free up more land for housing.
But it’s not just land supply that can help. Elected officials can assist housing developers by utilizing Tax Increment Financing tools, whereby the government reimburses a private developer as incremental taxes are generated from housing development. There are many tools like this at the government’s disposal to help boost housing supply, and I sincerely hope that they start to take this critical issue more seriously.
About Matthew Gardner
As Chief Economist for Windermere Real Estate, Matthew Gardner is responsible for analyzing and interpreting economic data and its impact on the real estate market on both a local and national level. Matthew has over 30 years of professional experience both in the U.S. and U.K.
In addition to his day-to-day responsibilities, Matthew sits on the Washington State Governors Council of Economic Advisors; chairs the Board of Trustees at the Washington Center for Real Estate Research at the University of Washington; and is an Advisory Board Member at the Runstad Center for Real Estate Studies at the University of Washington where he also lectures in real estate economics.
This article originally appeared on the Windermere blog November 14th, 2022. Written by: Matthew Gardner.
We earn the trust and loyalty of our brokers and clients by doing real estate exceptionally well. The leader in our market, we deliver client-focused service in an authentic, collaborative, and transparent manner and with the unmatched knowledge and expertise that comes from decades of experience.
2737 77th Ave SE, Mercer Island, WA 98040 | (206) 232-0446
mercerisland@windermere.com
© Copyright 2022, Windermere Real Estate/Mercer Island.
How to Avoid Overpaying for a Home in a Transitioning Market

Look Carefully at the Home Itself
Here are four home attributes beyond the number of bedrooms and baths that you should have your eye on…
Home (building) quality: Very well-built homes are a rare find and typically worth every penny of their price. Don’t confuse them with so-so homes that just measure up to the city inspector’s threshold. Lesser quality homes will cost you more in upkeep and replacement as systems and components wear out. If you purchase a lesser quality home for less, the differential might just cover the added maintenance expense. But, if you purchase a fair quality home at the going rate of higher quality homes, you might likely be overpaying.
Deferred maintenance: Different than home quality, deferred maintenance includes the to-do list of items that need to be done to maintain a home’s integrity. A home that has been well maintained over its life typically is a better investment than one that hasn’t. The true cost of deferred maintenance often adds up to more than the cost of the repairs themselves. Don’t forget to factor in the reduced life span of other components—like replacement of damaged wood beneath peeling paint or mold remediation in a damp basement caused by a clogged foundation drain.
Setting: The saying “location, location, location” didn’t get its fame from out of nowhere. A home with an ideal setting on its lot and in the neighborhood—away from busy roads and utility poles/boxes, with adequate privacy, good topography, best positioned to capture views if available, and not adjacent to undesirable elements (poorly maintained homes, water towers or other unsightly public structures, high traffic facilities, etc.) will have more value than a less-ideally sited home. When deciding what to pay for a property it is critical that you evaluate these aspects and any others relevant to a specific neighborhood to determine the +/- effect on value.
Floor plan: How a home lives—flow from room to room, size of rooms, open/closed-off spaces, and below ground vs. above ground living are every bit as important as the total home square footage. You can change a lot of things about a home, but it is very difficult to change a bad floor plan. When you are deciding how high to make that multiple offer bid, consider factoring in the added value or take-away of the floor plan.
Beyond the Four Walls
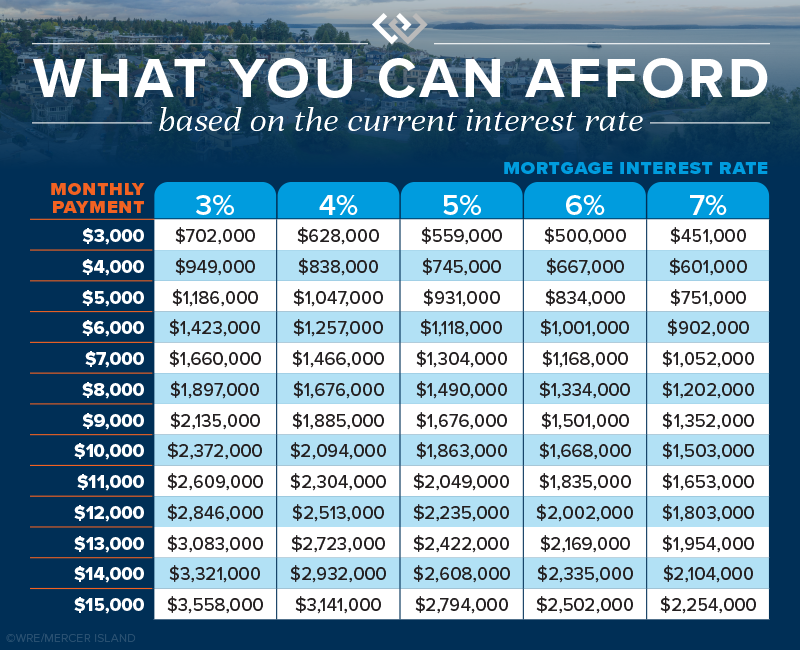
Interest Rates: In addition to being more selective about the home itself, it pays off to understand how interest rates impact your monthly housing cost. It’s a bigger deal than you might think. Every 1% increase in interest rate equates to roughly a 10% decrease in buying power. Said differently, a 10% drop in home sale price would be wiped out by a subtle 1% increase in mortgage interest rate. This means you can obtain a much more expensive home when rates are low, whereas higher rates get you less home—even though you still pay the same monthly payment.
If you have $5,000 a month to budget for a house payment (before taxes and insurance), you could purchase a $931,000 house at a 5% mortgage rate. If rates went up to 6%, the same monthly payment would only get you an $834,000 home. Your buying power diminishes considerably with each bump up in rates.
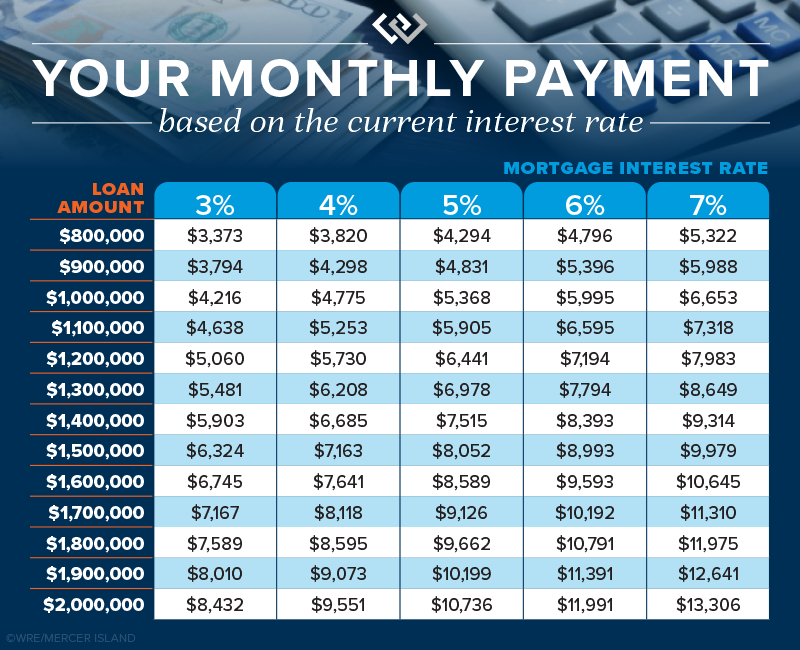
This second chart below shows how interest rates impact monthly payments. If you’re purchasing a $950,000 house at a 5% interest rate, you’ll be paying $596 less every month than if rates were 6%. That adds up quick…$7,152 in one year alone!
Job and Location Stability: Like nearly any investment vehicle, being able to buy and sell on your own time allows you take advantage of ideal market conditions or hold until a more favorable market returns. In an uncertain market, you should plan to be able to stay put for a minimum of 5-7 years if needed. If relocation or job loss is a distinct possibility, waiting to buy might avoid loss as a result of an untimely sale.
Homeownership Lifestyle: For many, homeownership represents a life accomplishment, independence, and financial security. For others, one more thing requiring maintenance and upkeep. Knowing where you stand (at this moment in time anyway) when it comes to evaluating the pros and cons of homeownership as a lifestyle choice is a better first step than an afterthought.
Final Thoughts
Want to know how you can best protect yourself in a changing real estate market? Reach out to us for help evaluating whether it would make financial sense to buy now or wait.
We earn the trust and loyalty of our brokers and clients by doing real estate exceptionally well. The leader in our market, we deliver client-focused service in an authentic, collaborative, and transparent manner and with the unmatched knowledge and expertise that comes from decades of experience.
2737 77th Ave SE, Mercer Island, WA 98040 | (206) 232-0446
mercerisland@windermere.com
© Copyright 2022, Windermere Real Estate/Mercer Island.